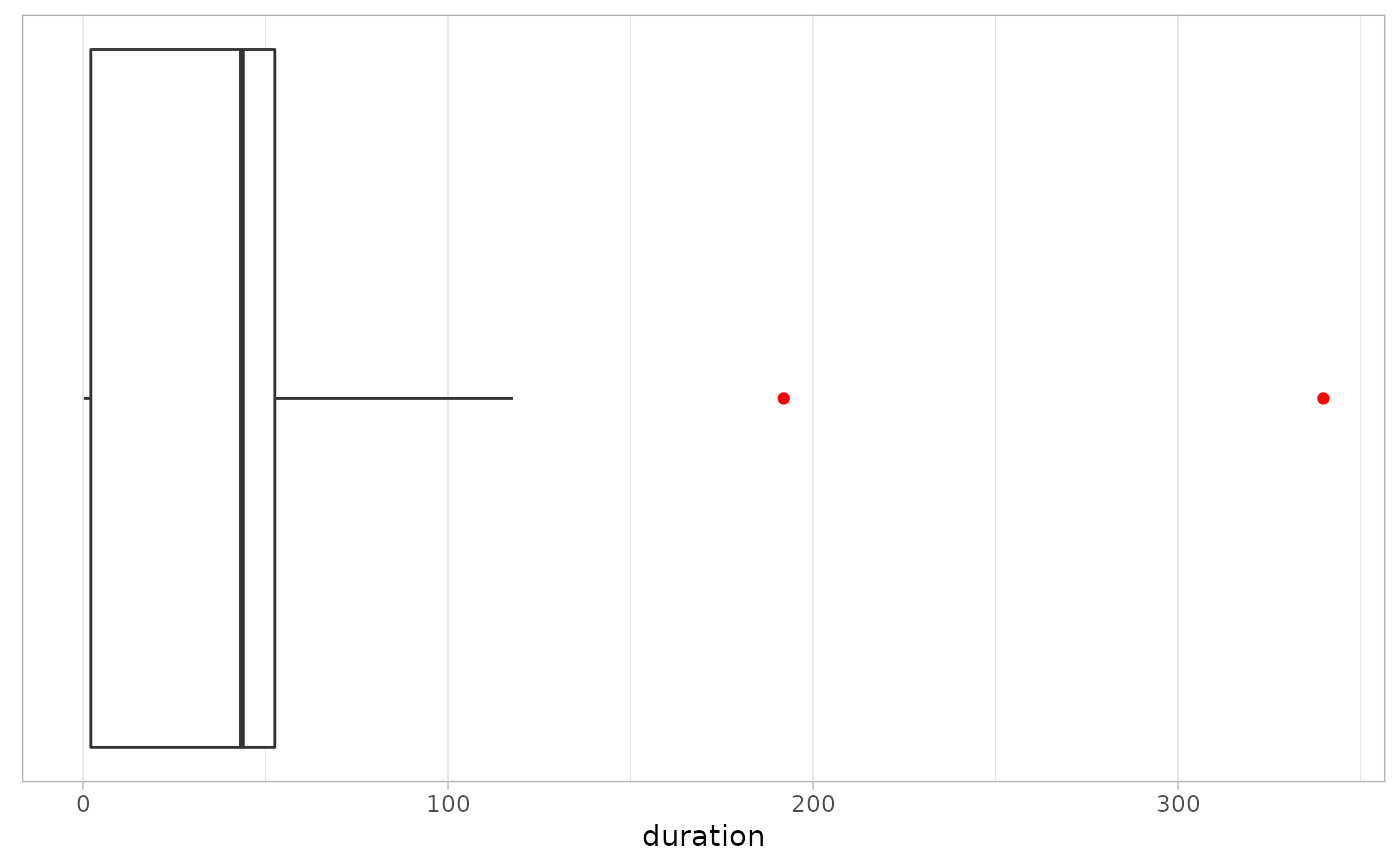
This function report the outlier durations for the surveys
assessmentDurationOutliers(
  ds = NULL,
  dates = NULL,
  sdval = 2,
  reportingColumns = c(enumeratorID, uniqueID)
)
Arguments
| ds | dataset containing the survey (from kobo): data.frame |
|---|---|
| dates | name of the fields where the information about the start and end date of the survey is stored: list of string (c('start_date','end_date')) |
| sdval | (Optional, by default set to 2) number of standard deviation for which the data within is considered as acceptable: integer |
| reportingColumns | (Optional, by default it is built from the enumeratorID and the UniqueID) name of the columns from the dataset you want in the result: list of string (c('col1','col2',...)) |
| uniqueID | name of the field where the survey unique ID is stored: string |
| enumeratorID | name of the field where the enumerator ID is stored: string |
Value
dst same dataset as the inputed one but with survey marked for deletion if errors are found and delete=TRUE (or NULL)
ret_log list of the errors found (or NULL)
var a list of value (or NULL)
graph graphical representation of the results (or NULL)
Author
Yannick Pascaud
Examples
{
ds <- HighFrequencyChecks::sample_dataset
dates <- c("survey_start","end_survey")
uniqueID <- "X_uuid"
enumeratorID <- "enumerator_id"
reportingColumns <- c(enumeratorID, uniqueID)
sdval<-2

list[dst,ret_log,var,graph] <- assessmentDurationOutliers(ds=ds,
                                                          dates=dates,
                                                          sdval=sdval,
                                                          reportingColumns=reportingColumns)
head(ret_log,10)
print(graph)
}