Check the surveyors with very low or high productivity
Source:R/functions_e.R
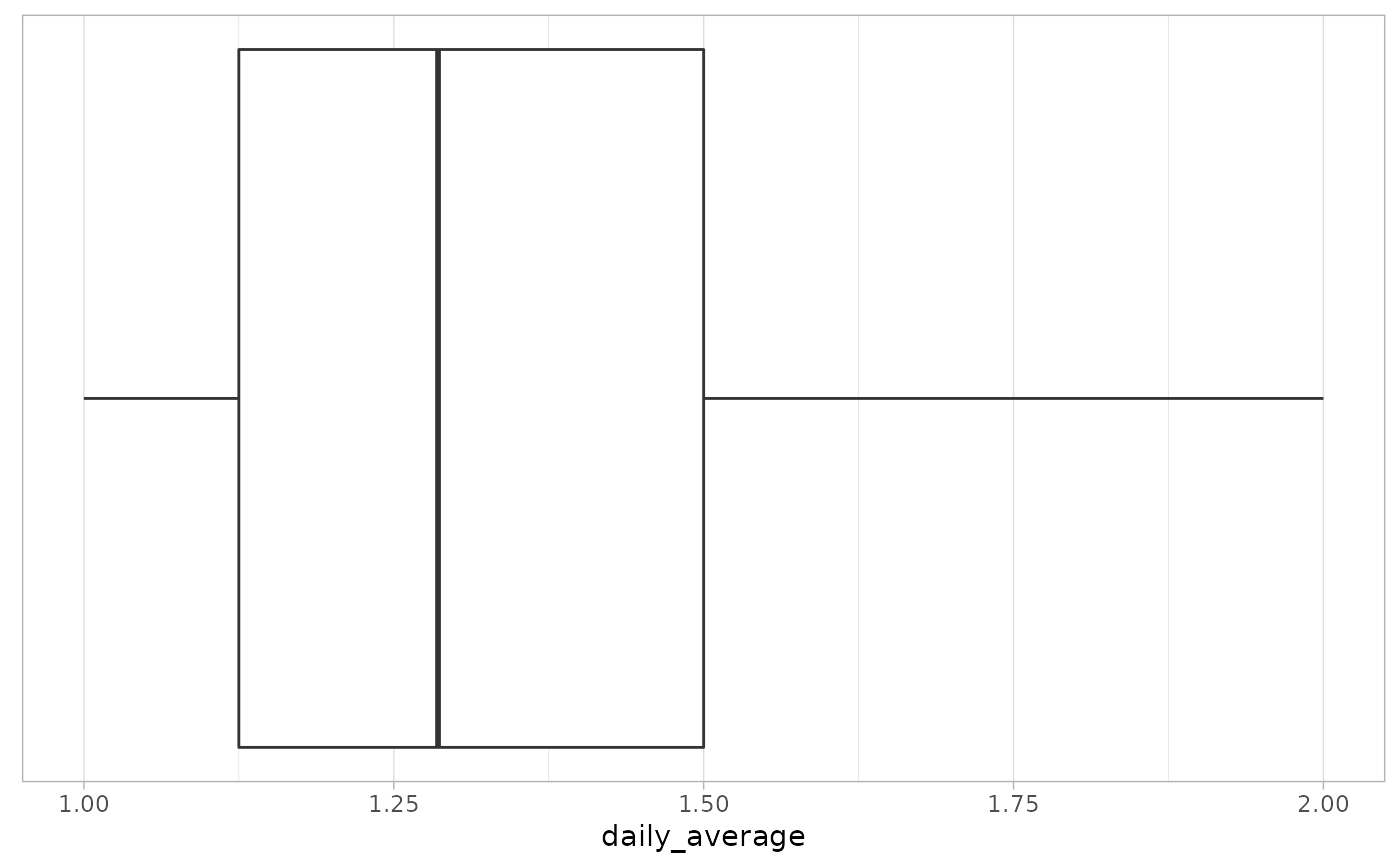
enumeratorProductivityOutliers.RdThis function display the surveyors with very low or high productivity.
enumeratorProductivityOutliers(
  ds = NULL,
  enumeratorID = NULL,
  surveyDate = NULL,
  sdval = 2
)
Arguments
| ds | dataset containing the survey (from kobo): data.frame |
|---|---|
| enumeratorID | name of the field where the enumerator ID is stored: string |
| surveyDate | name of the field in the dataset where the date of the survey is stored: string |
| sdval | (Optional, by default set to 2) number of standard deviation for which the data within is considered as acceptable: integer |
Value
dst same dataset as the inputed one but with survey marked for deletion if errors are found and delete=TRUE (or NULL)
ret_log list of the errors found (or NULL)
var a list of value (or NULL)
graph graphical representation of the results (or NULL)
Author
Yannick Pascaud
Examples
{
ds <- HighFrequencyChecks::sample_dataset
enumeratorID <- "enumerator_id"
surveyDate <- "survey_date"
sdval<-2

list[dst,ret_log,var,graph] <- enumeratorProductivityOutliers(ds=ds,
                                                              enumeratorID=enumeratorID,
                                                              surveyDate=surveyDate,
                                                              sdval=sdval)
head(ret_log,10)
print(graph)
}