Challenges with Household Survey analysis
Household survey often results in dataset with over 300 variables to process & explore. In Humanitarian Environment, deadlines to get insights from those dataset are often tight. Manual processing is very lengthy and can be done only for a limited part of the dataset. Often, because of those challenges, a lot of potential insights are not discovered. This package is developped to support this challenge around data crunching. It’s part of the initiative around an Integrated Framework for Household Survey (IFHS): A toolkit to facilitate design, collection & analysis.
Data Crunching
KoboloadeR packages aims at separating “input”, “processing” and “output” within the data crunching phase of the data analysis worklfow.
The “output” will be one or multiple Rmd (Rmarkdown) file(s) than will generate word, pdf or html reports and the configuration file includes references to all “input”:
Path to raw data files collected using OpenDataKit, Kobotoolbox or ONA
Path to form (defined using the standard format xlsform) in order to build a data dictionary
Path to the sample weight for each observation (based on cluster or strata…)
Path to the data cleaning log
Path to the indicator calculation sheet
Advantage of KoboLoadeR
Productivity: Once the configuration file is written, run the script in Rstudio to get the output
Training: No need to write R instruction – limited knowledge of R is required
Iteration: Check the output, adjust the various input files & re-run the script till you get a satisfying report
Reproducibility: all analysis input are de facto documented
KoboLoadeR takes care of the processing component so that the technical team can focus on the interpretation.
Features
The koboloadeR package allows to:
connect to the KoBo API (v1) for the KoBo Toolbox project.
compute a data dictionnary based on xlsform. It implies ot have a few additionnal column in the xlsform in order to better define how data shoudl be analysid (cf infra). as it based on a standard, this part and the following should work for any xlsform compatible server such as OpenDataKit or ONA
generate automatically of a series of charts & maps based on the data dictionnary
generate automatically of a series of charts & maps based on a formatted data analysis plan
access to a series of dedicated Shiny application to set up your project
support the full range of data science level
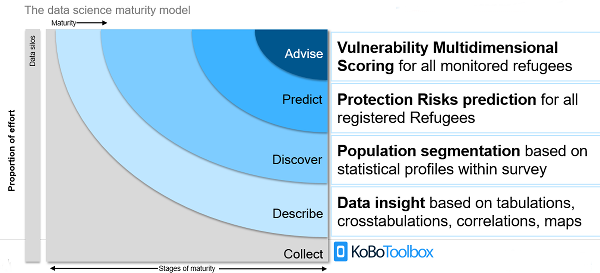
alt text
Output from the package
Frequency tables & Bar chart for select type questions
Frequency tables & Histogram for numeric questions
Frequency table for text questions
Cross-tab & graph (if 2 categorical: bar chart, if 1 categoric + 1 numeric: boxplot & if 2 numeric: scatterplot)
Chi-squared test & corrplot presentation
Mapping if geographic field are configured (still in development)
and more to come…