
koboloadeR is a metapackage, that brings together a series of specialised packages in an organised data analysis workflow, to conduct data discovery and analysis for data collected through KoboToolbox, ODK, ONA or any xlsform compliant data collection platform.
This package first builds on the capacity of UNHCR Kobo server but it can also be used from any structured dataset. It comes as a companion tool to the Integrated Framework for Household Survey.
koboloadeR aims at helping humanitarian data analysts to focus in data interpretation by saving the time needed to quickly generate the graphs and charts required to discover insights from a dataset. It also ensure analysis reproducibility through a separation of the analysis configuration and the analysis process. The package allows to account for sample weights and hierachical dataset structure (both capacities that are not available through the default reporting engine or the excel-analyzer).
Approach
The main concept behind the package is to implement a survey data analysis plan and configuration directly within the same xlsform excel file that has been used to develop the questionnaire. A few additional column are created in this excel document, the package read those column to generate a series of predefined report.
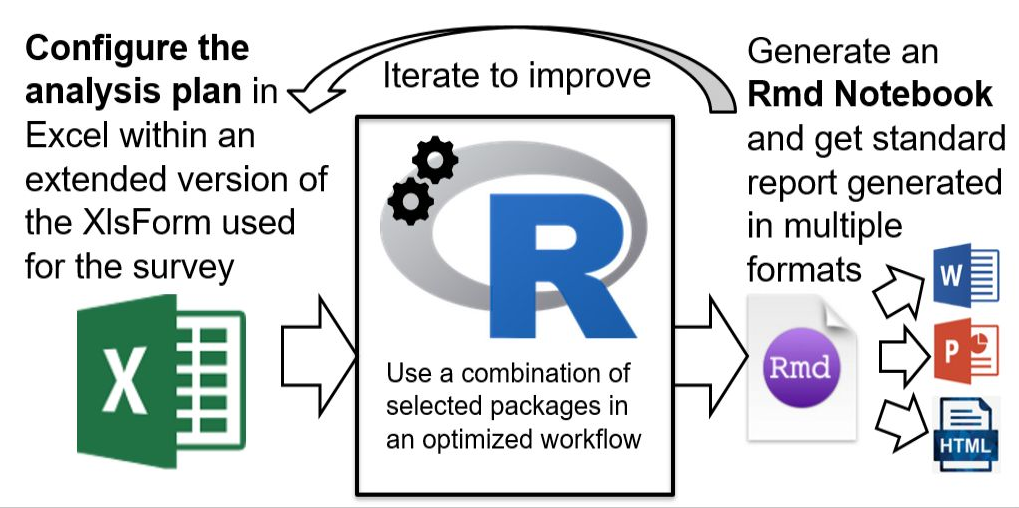
The approach offered through the package has the following advantages:
End users do not need to code in R and to master the language in order to use the package as the configuration is done in excel;
The data analysis plan is de facto fully documented and described;
The resulting data crunching reports are fully reproducible;
Analysis iterations are facilitated;
Good practices are enforced through the package.
A more detailed introduction to the concepts used in the package is presented in the Data Crunching article.
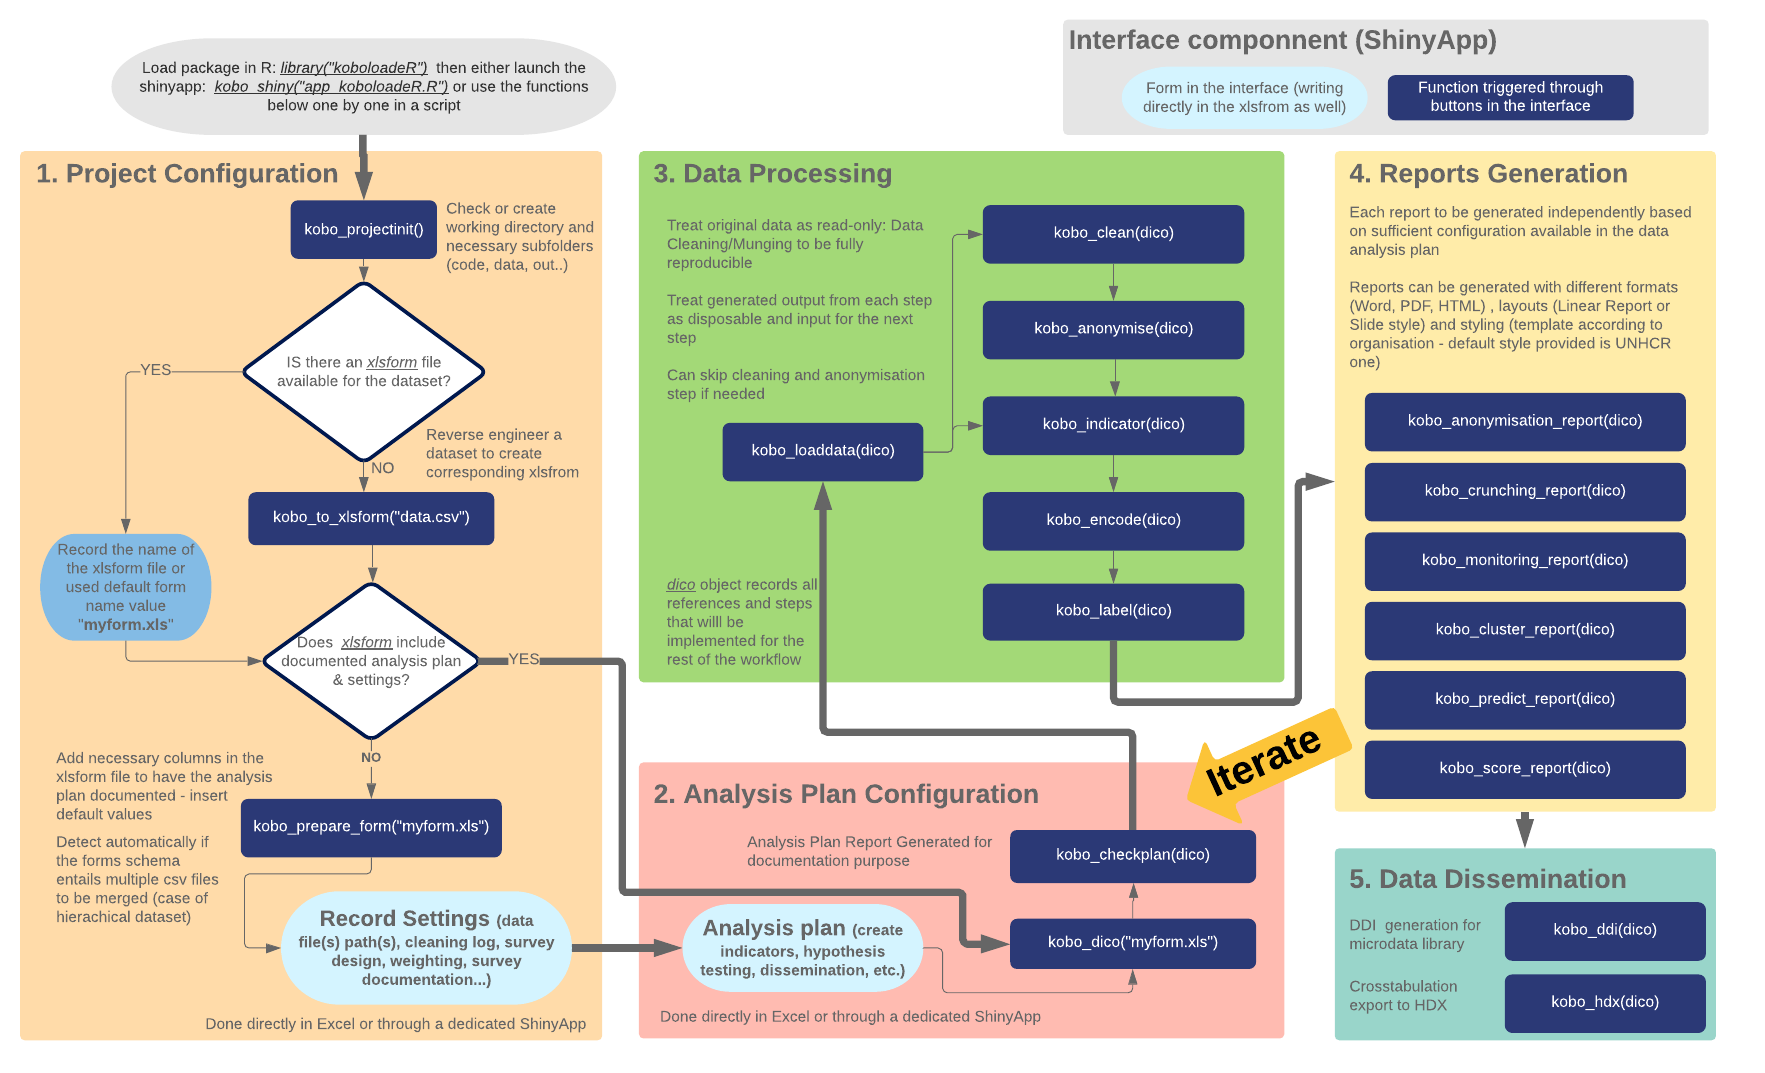
The data crunching allows to generated quickly initial reports through a series of semi-automated processes:
Have all the configuration used to generate the reports (details of tabulation and crosstabulation plans, weighting approach) documented within the xlsform allow to track easily all changes to the data and to facilitate ( koboloadeR::kobo_dico)
Have a clear and consistent folder structure and naming conventions for all the files coming in and out of the crunching workflow ( koboloadeR::kobo_projectinit)
Ensures that files containing questions and respondents have been all considered: form & data to be checked to each other ( koboloadeR::kobo_check_analysis_plan)
Make question and choices labels readable within charts by adjusting them where needed (for instance question labels to be less than 80 char and choices labels less than 40), resolve typos if any… ( koboloadeR::kobo_label and koboloadeR::kobo_encode
Merge household data with individual-level data – when using repeat components. There’s a file of data at the household-level and another file containing data on the individuals that constitute those households. There should be unique identifying codes that match households and individuals ( koboloadeR::kobo_load_data
Review and potentially re-categorize open-ended answers when “or other” option was offered ( koboloadeR::kobo_clean )
Measure statistical disclosure risk in order to remove sensitive data and indirect identifiers koboloadeR::kobo_anonymise and koboloadeR::kobo_anonymisation_report )
Create new variables out of existing variables (also called feature engineering). For instance Group distinct answers into categories or ranges, Split up or extract components from an answer, aggregate variable collected at individual level to the household level ( koboloadeR::kobo_indicator )
Generate easy to read visualization for all tabulations, cross-tabulations and correlation ( koboloadeR::kobo_cluster_report )
Identify population segments, i.e. statistical clusters, based on similar characteristics ( koboloadeR::kobo_crunching_report)
You can have a look at some examples of output reports here.
Environment setup
Software installation
Install R: follow instruction from the installer.
Only for windows user Install RTools: This executable is needed to install the package from github. Follow instruction from the installer.
Install R Studio : follow instruction from the installer
You can now Launch R Studio . You may check the list of common issues in the Common Troubleshooting article.
Package installation from Github
Note that the package is still in beta-version. We hope to have soon a release available on CRAN.
- Open R studio interface and within the R console, install
devtoolspackage:
install.packages("remotes")- Install koboloadeR:
remotes::install_github("unhcr/koboloadeR", Ncpus=4)

## Use UNHCR graphical template- https://unhcr-web.github.io/unhcRstyle/docs/
remotes::install_github('unhcr-web/unhcRstyle')- You are all set! You can know use koboloadeR. If you have a problem consult the common troubleshooting part at the end of this page.
Quick Project Walk Through
You can consult the vignettes for a detailed guidance
Create project
In R Studio, select File, click New project. A box opens
Choose New Directory
Choose Empty project
Type the name of the folder where you want to put your data
Select where you want to put this folder
Click Create project
Then setup a few things: run those two lines:
library (koboloadeR) # This loads koboloadeR package

kobo_projectinit() # Creates folders necessary and transfer files needed
It might take a while as a few other packages have to be installed or loaded. Once the see the " >" again at the beginning of the line, you are ready to start
Console mode
The console mode is recommended - You can run the file run-analysis.R that is automatically copied in the code folder after you run the kobo_projectinit() function .
This will be likely the quickest options, once your are used to the package.
Note however that this implies that you configure correctly on your own the full configuration within the xlform file.
NOT MAINTAINED - Support would be wellcome - Graphical user interface (GUI)
A shinyApp to guide user through all those steps has been prototyped - unfortunately - it’s not maintained with the last dev and might be buggy…
All instructions and options for the project configuration and analysis plan settings shall be do-able through a dedicated GUI.
kobo_shiny("app_main_koboloadeR.R")For better performances, select “Open in Browser” on the top of the window.
Contributing
Contributions to the packages are welcome. Please read first the contribution guidelines, follow the code of conduct and use the issue template.
To go in more details, the suggested work-flow is presented below (note that all of it is not yet fully implemented - see issue tracking for more details). You can read the function documentations directly.
This package is part of
unhcrverse, a set of packages to ease the production of statistical evidence and data stories. You can install them all with the following:
## Use UNHCR Open data  - https://unhcr.github.io/unhcrdatapackage/docs/
remotes::install_github('unhcr/unhcrdatapackage’)

## API to connect to internal data source - https://unhcr-web.github.io/hcrdata/docs/
remotes::install_github('unhcr-web/hcrdata’)

## Perform High Frequency Check https://unhcr.github.io/HighFrequencyChecks/docs/
remotes::install_github('unhcr/HighFrequencyChecks’)

## Process data crunching for survey dataset - https://unhcr.github.io/koboloadeR/docs/
remotes::install_github('unhcr/koboloadeR’)

## Use UNHCR graphical template- https://unhcr-web.github.io/unhcRstyle/docs/
remotes::install_github('unhcr-web/unhcRstyle')


