Analysis Workshop
The Goal of the analysis workshop is to review of data patterns in order to collect qualitative interpretations. This workshop should stimulate discussions from each presentation. input provided and any decisions taken about changes or additions to the analysis presented should be cautiously recorded.

Workshop preparation: identify patterns
While identifying categories and sorting the data, you will start to see patterns within and between categories. At this stage it will be important to assess the relative importance and relationships between those categories. You may want to look at:
- How many times a specific category came up?
- What are the key ideas being expressed?
- What similarities and differences are being expressed?
- If two or more categories consistently appear together for one group?
Relationships might suggest a cause and effect; this will help you to explain why something occurs. You can ask yourself:
- How do things relate?
- What data supports this interpretation?
- What responses are contradicting findings and/or do not fit into categories?
- Are they important to the overall understanding?
Data Digest Presentation
Data Analysis Workshop are among common good practices. .
- Engage with various levels (Field, Sector, Partner, Authority..)
- Facilitation around “data digest” (±60 slides for 3 hours session)
- Rapporteur to capture (extensive note taking):
Faciliation & Note taking
Having sorted and identified the relationships, relative importance and possible causes, you need to bring it all together. You have to interpret the data: what does it all mean?
- Take a step back and look at what you learned. Ask yourself for example:
- What will those who are using the findings of the information be most interested in?
- What new things did you learn about the protection situation?
- What main protection risks for several and/or specific population groups did appear?
- What is the scale of a given problem/protection risks?
- Are there particular groups within the population who are particularly exposed to specific problems/risks?
- Did you confirm patterns mentioned in earlier reports or did you see new trends?
- The protection problems observed are there isolated incidents or generalizable trends?
- Are the incidents related to the crisis/emergency/conflict or are they more related to endemic issues such as cultural practices or generalized poverty?
Practical steps during the slides review
- Reflect:

Data quality and or suggestions to change questions
- Interpret:

Qualitative interpretations of data patterns
- Recommend:

Programmatic adjustment (3RP or COP design)
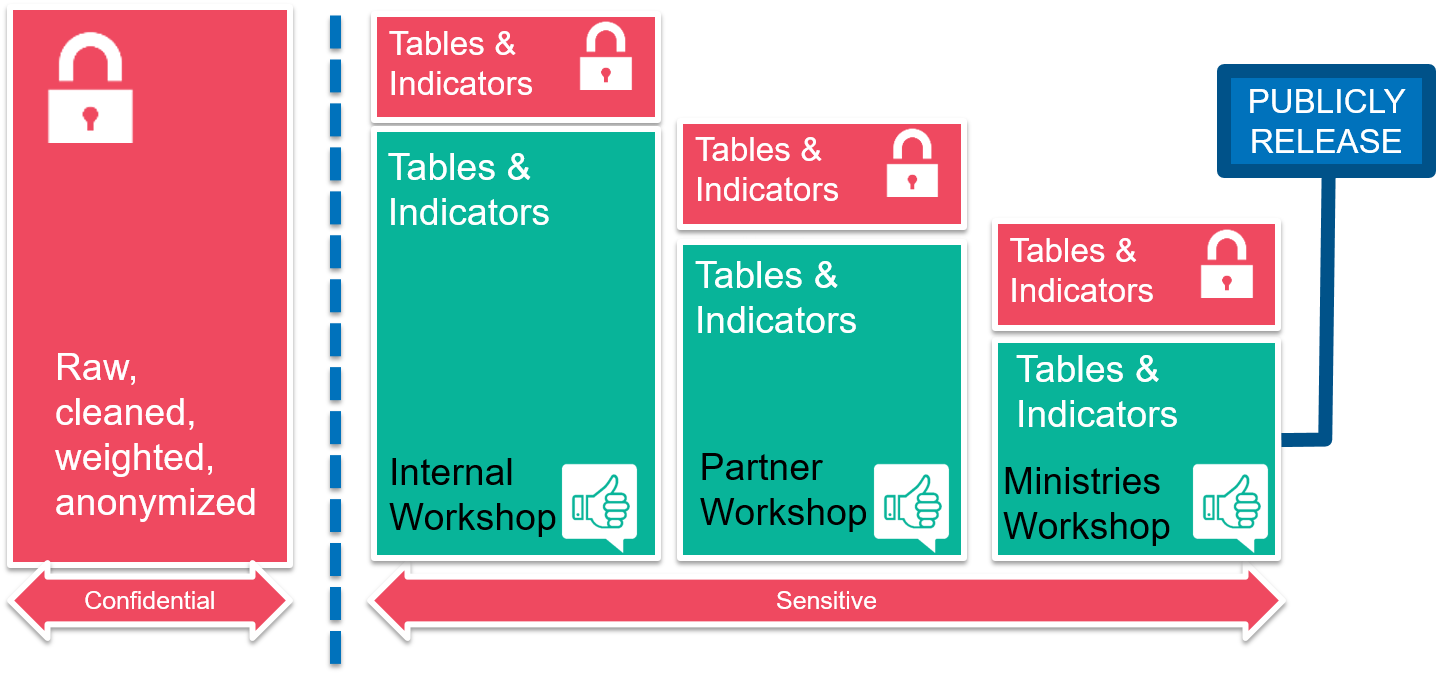
- Classify:

Level of sensitivity for the information
Clearance process
Styling guide
Confidence intervals:
- Different software often calculate confidence intervals as being negative and hence below zero or above 100. Negative confidence intervals or CI above 100 are meaningless. In the report, always round negative confidence intervals to ‘0’ and round those above 100 to ‘100’.
Rounding decimal points:
- Make sure to round properly decimal points according to basic rules:
- When decimal is between 1-4, round down.
- When decimal is between 5-9, round up.
Decimal points in the results:
- When the results is a whole number e.g. 30%, make sure to always write 30.0% with the ‘.0’ in the decimal place in the report. This ensures that the decimal point was not forgotten and is actually equal to zero.
Missing data or consent not provided:
- Data should be excluded from all analysis and should not be accounted for in the denominator.
Always clean the data first before going into analysis:
- Frequencies and means should be run on categorical and continuous variables, respectively.
- Missing data should be looked at and a record of them should be kept.
Age variable:
- When selecting age or creating an age variable category in Epi info software from the ‘months’ variable generated by ENA, don’t forget the ‘.99’ otherwise some children with an exact birth date may be excluded from the analysis. E.g. 6-23.99 (and not 6-23 or 6-23.9).
Reproducible Analysis
Always save newly generated variables into a new data file named following a naming convention to be respected by all involved in the survey data analysis.