Data Crunching
Key Take Away :
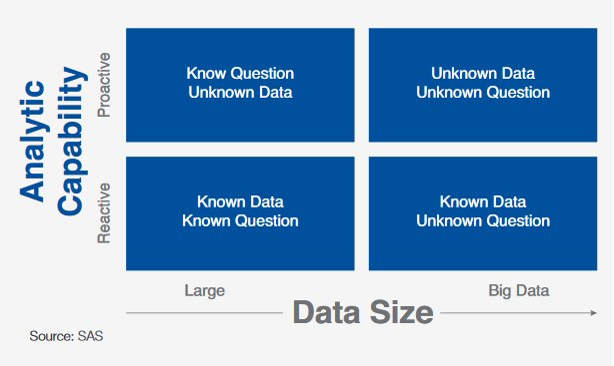
Challenges with Household Survey analysis
Household survey often results in dataset with over 300 variables to process & explore. Deadline to get insight from the dataset are often tight and Manual processing is very lengthy and can be done only for a limited part of the dataset. Often, because of those challenges, a lot of potential insights are not discovered.
To address this, it’s necessary to move from a reactive support to a proactive one.
Data Crunching is about automating processes:
Upstream process of data interpretation: consists of the preparation of a dataset so that it can be processed, sorted and structured to run algorithms and program sequences on it;
Can save a lot of time as the processes do not need to be performed manually (different from data munging and data wrangling that refers manual processing of data);
Can be iterative when the output of the crunching process includes new data or reveals errors. This means that the program sequences may be repeated until the desired result is achieved;
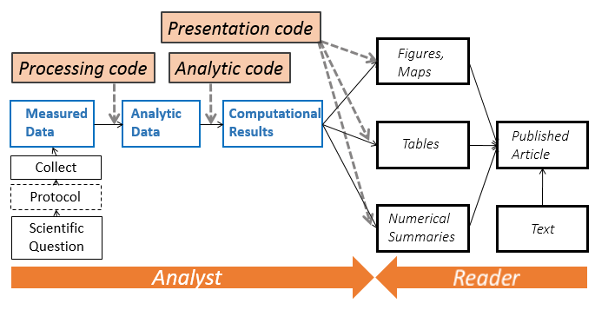
Enable better analysis reproducibility (minimize point & click interventions) to facilitate peer review
Data Crunching Automation
Using the right combination of packages from the R statistical language, it is possible to integrate all necessary data analysis steps into scripts:
Data management (clean, recode, merge, reshape)
Data analysis (test, regression, multivariate analysis, etc…)
Data visualisation (plot, map, graph…)
Writing up results (report and presentation generation)
Using KoboloadeR to facilitate reproducibily.
Before data visualization & interpretation many steps are required:
Import raw data
In a structured survey with numbered questions, the flat file type of data structure has a column for each question, and a row for each respondent. A more complex survey data structure arises if the data are hierarchical. A common type of hierarchy is where a series of questions is repeated say for each child in the household, and combined with a household questionnaire, and maybe data collected at community level. For analysis, we can create a rectangular flat file, at the ‘child level’, by repeating relevant household information in separate rows for each child. Similarly, we can summarise information for the children in a household, to create a ‘household level’ analysis file.
In the case of hierearchical dataset, it is required to use ODK Briefcase to export and configure the key to join the frame together.
Recode & Relabel
- Leverage the same xlsform file (saved as .xls – not .xlsx) already used to encode the questionnaire to generate a data dictionary
- Extend xlsform by adding additional column (chapter, disaggregation, correlation, etc.)
- Potentially revise label wording to make them more concise when they will appear on the output chart
Clean records
- Cleaning Log defined though the iteration of the crunching
- Log stored as a worksheet, act as documented data audit trail
- Log actions to be sorted as “update” or “delete”
- Log to be re-applied every time to raw date
Reweight dataset according to sampling strategy,
- Associate a weight to each record
- Weight defined by the sampling script (can be based on cluster, or Respondent Driven Sample)
- Possibility to use post-stratification to re-compute corrected weights in case of low coverage of the sample
Build new indicators from existing variable, etc.
Indicators are summary measures. They often provide a baseline from which to weigh up the finer points. It is important not to create unnecessary confusion. An indicator should synthesise information and serve to represent a reasonable measure of some issue or concept. The concept should have an agreed name so that users can discuss it meaningfully.
Create new indicators from existing one: Need to define in a worksheet for each indicator: type, name, label, chapter, correlation, aggregation, formula, frame
Indicators formula written with a R-ready syntax: Allow for complex notation:
- May need to use dcast if you want to calculate an indicator based on values from a nested data frame. dcast will work as pivot table using the unique ID used for the join.
- May need to use if when trying to do a calculation where you could have potential zero as numerator Indicators are calculated, appended to the right data frame and then the indicator definition is appended in the data dictionary
KoboloadeR
It is An R packages (i.e. a series of functions) that can be plugged to a configuration file in order to separate “input”, “processing”, and “output”
- The “output” is an Rmd (Rmarkdown) file than produce word, pdf or html reports
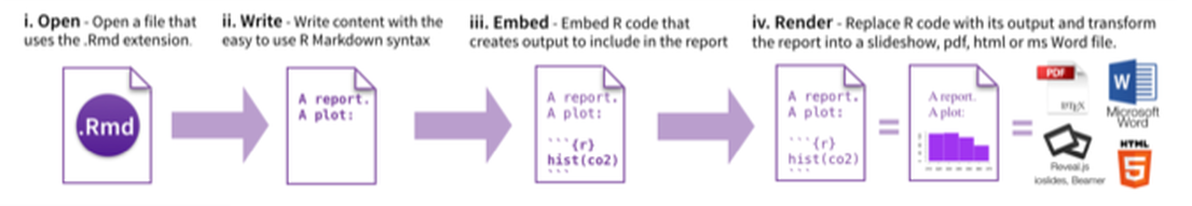
The configuration file includes references to all “input”:
 Path to raw data files
 Path to form (in xlsform) in order to build a data dictionary
 Path to the sample weight
 Path to the data cleaning log
 Path to the indicator calculation sheet
Collaborative Development
Open Source Package maintained in GitHub
Submit issues for bug report or feature request in Github
Fork and submit pull request for code review and integration