Prepare Data
thisbureau <- "Americas"
lastyear <- max(unhcrdatapackage::end_year_population_totals_long$Year)
end_year_population_totals_long.asy <- dplyr::left_join( x= unhcrdatapackage::end_year_population_totals_long,
                                                     y= unhcrdatapackage::reference,
                                                     by = c("CountryAsylumCode" = "iso_3"))

asylumseekerAM2020 <- end_year_population_totals_long.asy %>%
  filter(Population.type  %in% c("ASY") &
           Year == lastyear &
           UNHCRBureau  == thisbureau &
           !(is.na(UNHCRBureau)) ) %>%
  group_by( CountryAsylumName) %>%
  summarise(Asylum = sum(Value) )  %>%
  filter(Asylum  > 50000)


asylum_decisionAM <- unhcrdatapackage::asylum_decisions %>%
  ## Add reference for the filters
  dplyr::left_join( unhcrdatapackage::reference %>%
                      select(coa_region = `UNHCRBureau`, iso_3),  by = c("CountryAsylumCode" = "iso_3")) %>%
  filter(coa_region == thisbureau #& Year == lastyear
  ) %>%
  group_by(CountryAsylumName, Year ) %>%
  mutate(Year = as.integer(Year) ) %>%
  summarise(Decided = sum(TotalDecided) ) %>%
  filter(CountryAsylumName  %in%  as.character(asylumseekerAM2020$CountryAsylumName))
#> `summarise()` has grouped output by 'CountryAsylumName'. You can override using the `.groups` argument.


asylum_applicationsAM <- unhcrdatapackage::asylum_applications  %>%
  ## Add reference for the filters
  dplyr::left_join( unhcrdatapackage::reference %>%
                      select(coa_region = `UNHCRBureau`, iso_3),
                    by = c("CountryAsylumCode" = "iso_3")) %>%
  filter(coa_region == thisbureau #& Year == lastyear
  ) %>%
  group_by(CountryAsylumName, Year ) %>%
  mutate(Year = as.integer(Year) ) %>%
  summarise(Applied = sum(NumberApplications) ) %>%
  filter(CountryAsylumName  %in%  as.character(asylumseekerAM2020$CountryAsylumName)) %>%
  filter(Year  > 2017) %>%
  dplyr::left_join( asylum_decisionAM,  by = c("CountryAsylumName", "Year")) %>%
  mutate(applicationrate = Decided / Applied  * 100 ) %>%
  mutate(applicationrate.cat = cut(applicationrate, breaks=c(0, 25, 50, 75,100, 500)))
#> `summarise()` has grouped output by 'CountryAsylumName'. You can override using the `.groups` argument.
Generate plot
## First test combine Number of Application & Ratio as color
rsdrate <- ggplot(asylum_applicationsAM,
aes(x = reorder(CountryAsylumName, Applied),
y = Applied,
fill= applicationrate.cat )) +
geom_bar( stat ="identity") +
#scale_fill_grey(start = 0.85, end = 0.15) +
#scale_fill_gradient(low = "#132B43", high = "#56B1F7") +
scale_fill_brewer(palette = "RdYlGn") +
#scale_fill_brewer(direction = -1) +
coord_flip() +
facet_wrap( vars(Year ), ncol = 3) +
scale_y_continuous( label = unhcRstyle::format_si()) + ## Format axis number
theme(legend.position="none") +
geom_hline(yintercept = 0, size = 1.1, colour = "#333333") +
unhcRstyle::unhcr_theme(base_size = 8) + ## Insert UNHCR Style
theme(panel.grid.major.x = element_line(color = "#cbcbcb"),
panel.grid.major.y = element_blank(),
panel.grid.minor = element_blank()) + ### changing grid line that should appear
## and the chart labels
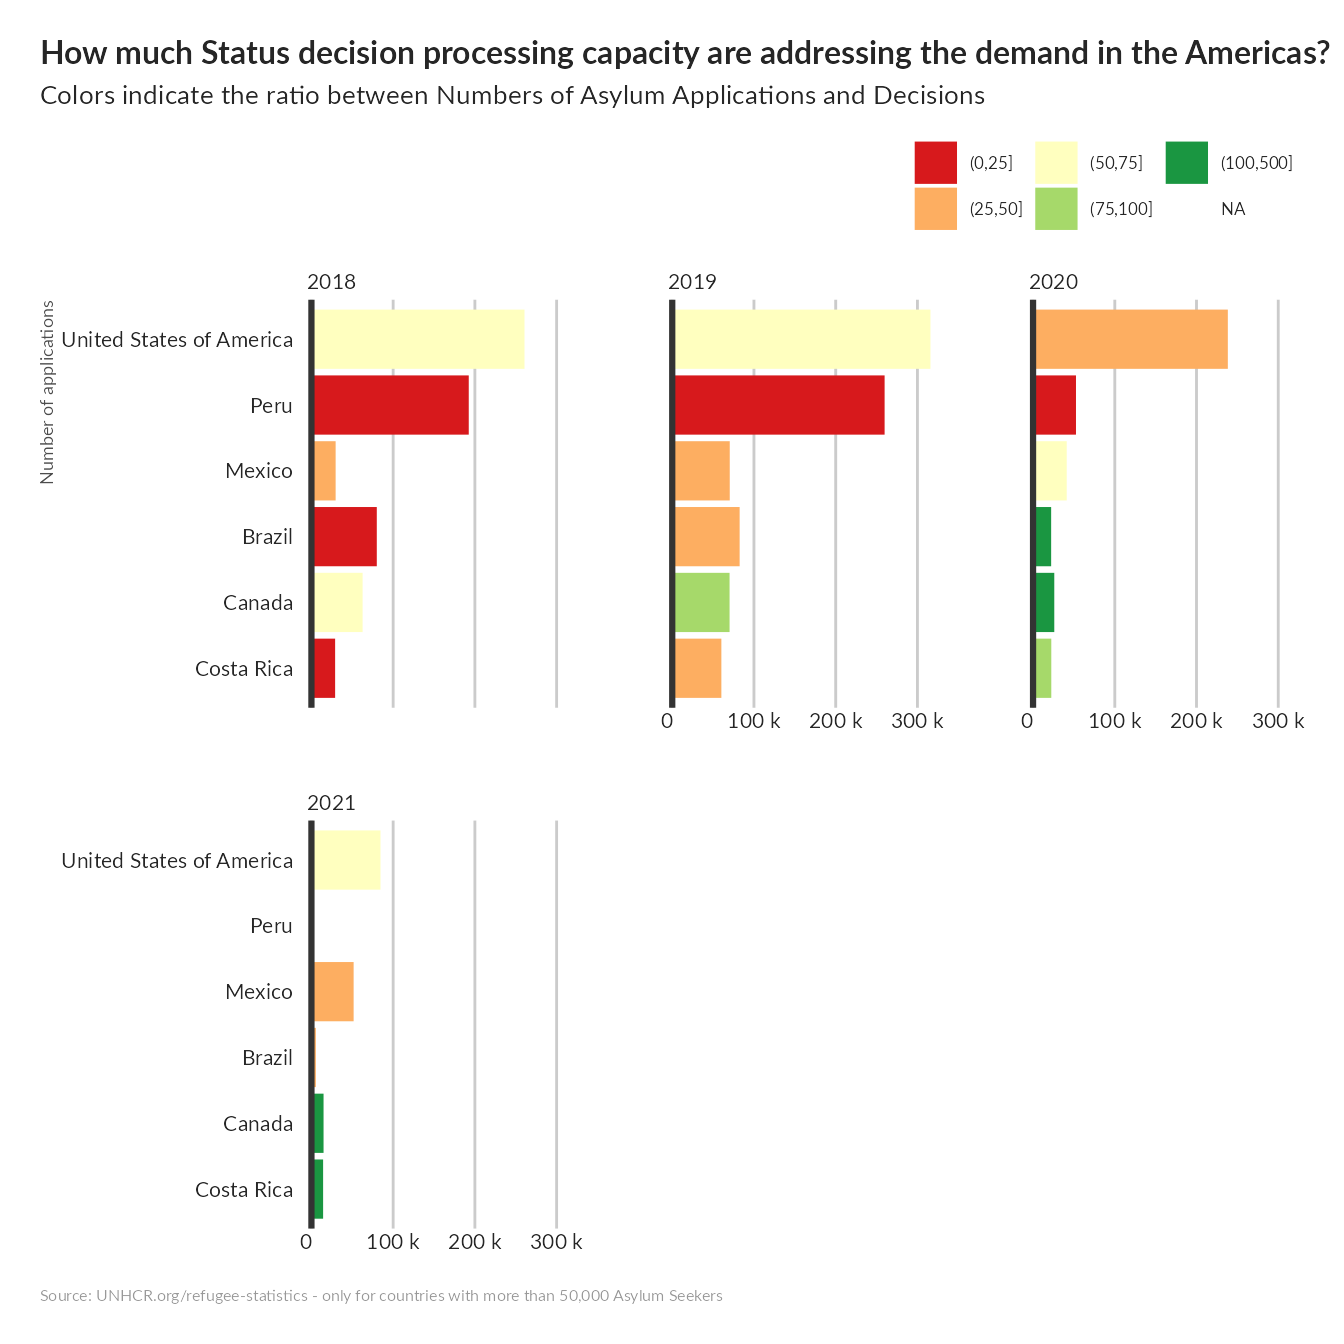
labs(title = "How much Status decision processing capacity are addressing the demand in the Americas?",
subtitle = "Colors indicate the ratio between Numbers of Asylum Applications and Decisions ",
x = "Number of applications",
y = "",
caption = "Source: UNHCR.org/refugee-statistics - only for countries with more than 50,000 Asylum Seekers")
rsdrate