Proportion of the population who are refugees, by country of origin
Source:vignettes/Proportion_Refugee_Country_Origin.Rmd
Proportion_Refugee_Country_Origin.RmdPrepare Data
thisbureau <- "Americas"
lastyear <- max(unhcrdatapackage::end_year_population_totals_long$Year)

end_year_population_totals_long.ori <- dplyr::left_join( x= unhcrdatapackage::end_year_population_totals_long,
                                                     y= unhcrdatapackage::reference,
                                                     by = c("CountryOriginCode" = "iso_3"))
wb_data <- wbstats::wb( indicator = c("SP.POP.TOTL",  ## Population total https://data.worldbank.org/indicator/SP.POP.TOTL
                                      "NY.GDP.MKTP.CD", ## GDP current https://data.worldbank.org/indicator/NY.GDP.MKTP.CD
                                      "NY.GDP.PCAP.CD", ## GDP per capita https://data.worldbank.org/indicator/NY.GDP.PCAP.CD
                                      "NY.GNP.PCAP.CD" ## GNI per capita, Atlas method (current US$) https://data.worldbank.org/indicator/NY.GNP.PCAP.CD
                                      ),
                startdate = 1951, enddate = lastyear, return_wide = TRUE)
#> Warning: `wb()` was deprecated in wbstats 1.0.0.
#> Please use `wb_data()` instead.
# # Renaming variables for further matching
names(wb_data)[1] <- "CountryAsylumCode"
names(wb_data)[2] <- "Year"
departed <- end_year_population_totals_long.ori %>%
  filter(Population.type  %in% c("REF","ASY","VDA") &
           Year == lastyear #&
           #UNHCRBureau  == thisbureau &
           #!(is.na(UNHCRBureau))
           ) %>%
  group_by(CountryOriginName, CountryOriginCode) %>%
  summarise(Value2 = sum(Value) )  %>%
  #mutate( value3 =  format_si(Value2)) %>%
  mutate(CountryOriginName = str_replace(CountryOriginName, " \\(Bolivarian Republic of\\)", "")) %>%

    ## Now merge with WB Data
  left_join(wb_data %>% select("SP.POP.TOTL","CountryAsylumCode", "Year") %>% filter(Year == lastyear-1), by = c(  CountryOriginCode = "CountryAsylumCode"    )) %>%
  mutate(ref.part = round(Value2/(SP.POP.TOTL+Value2),4)  )  %>%
  arrange(desc(ref.part)) %>%
  head(10) #%>% #%>%
#> `summarise()` has grouped output by 'CountryOriginName'. You can override using the `.groups` argument.
Generate Plot
Proportion of the population who are refugees, by country of origin (SDG Indicator 10.7.4)
departedplot <- ggplot(departed,
       aes( x= ref.part, fct_reorder(CountryOriginName, ref.part))) +
 # geom_col(fill = "#0072BC") +

  geom_col( fill = ifelse(departed$CountryOriginCode %in% c("SYR"), "#0072BC", "#CCCCCC")) +

  geom_label(aes(label = scales::percent(ref.part, accuracy = .1)),
             color = "black", hjust = "inward") +
  scale_x_continuous(labels = scales::label_percent(accuracy = .1)) +
  labs(x = NULL,
       y = NULL,
       title = paste0("Number of refugees, asylum seekers & displaced across borders by country of origin"),
       subtitle =     "Top 10 Countries, as a proportion of the national population of that country of origin",
         caption = "Total count of population who have been recognized as refugees as a proportion of the total population of their country of origin, expressed per 100,000 population.  Refugees refers to persons recognized by the Government and/or UNHCR, or those in a refugee-like
situation.  Population refers to total resident population in a given country in a given year.") +
  geom_hline(yintercept = 0, size = 1.1, colour = "#333333") +
  unhcRstyle::unhcr_theme(base_size = 8) + ## Insert UNHCR Style
  theme(panel.grid.major.x = element_line(color = "#cbcbcb"),
        panel.grid.major.y = element_blank()) ### changing grid line that should appear

departedplot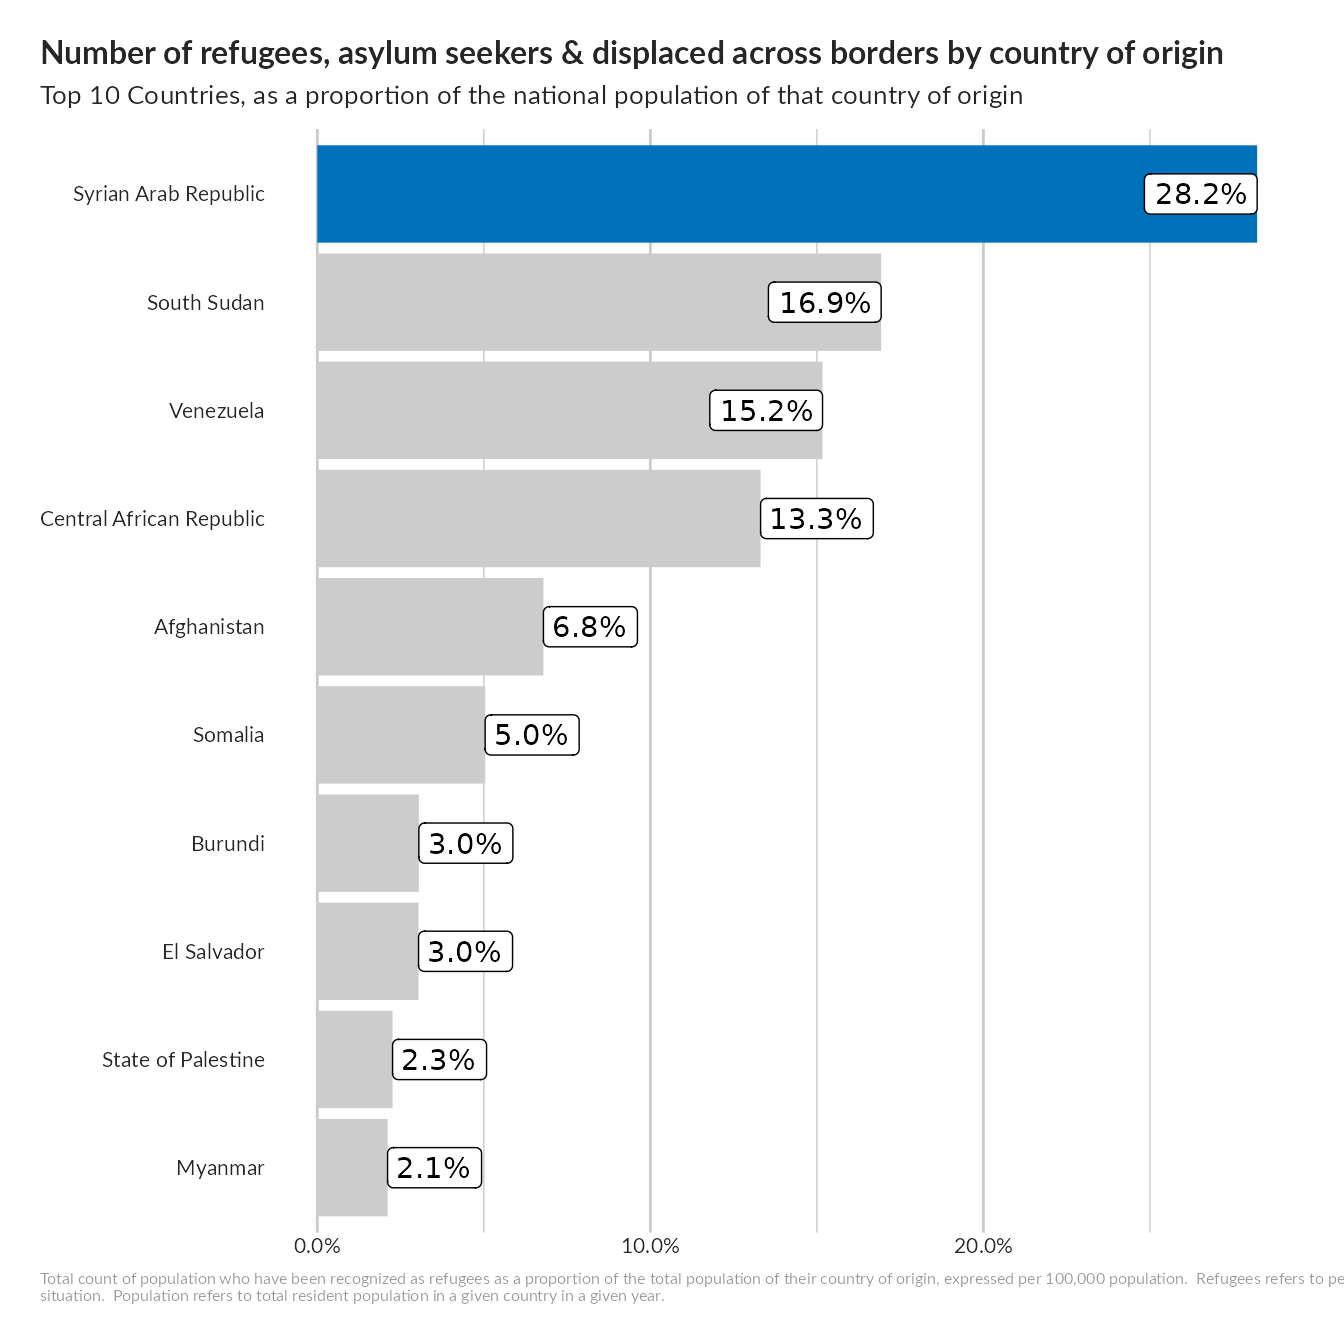
```