Prepare Data
The map is presented with the Bertin 1953 projection
thisbureau <- "Americas"
lastyear <- max(unhcrdatapackage::end_year_population_totals_long$Year)

end_year_population_totals_long.asy <- dplyr::left_join( x= unhcrdatapackage::end_year_population_totals_long,
                                                     y= unhcrdatapackage::reference,
                                                     by = c("CountryAsylumCode" = "iso_3"))

## Now get the rank from high to low for all countries per  year and population type
rank_data <- dplyr::left_join( x= unhcrdatapackage::end_year_population_totals_long,
                                                     y= unhcrdatapackage::reference,
                                                     by = c("CountryAsylumCode" = "iso_3")) %>%
  group_by(Year, CountryAsylumCode, CountryAsylumName ) %>%
  summarise(Value = sum(Value) )
#> `summarise()` has grouped output by 'Year', 'CountryAsylumCode'. You can override using the `.groups` argument.


rank_data <- end_year_population_totals_long.asy %>%
  group_by(REGION_UN, Year, Population.type, CountryAsylumName, CountryAsylumCode) %>%
  summarise(Value2 = sum(Value) )
#> `summarise()` has grouped output by 'REGION_UN', 'Year', 'Population.type', 'CountryAsylumName'. You can override using the `.groups` argument.


#str(as.data.frame(rank_data))
rank_data <- as.data.frame(rank_data)

rank_data.ref <- rank_data %>%
  group_by(REGION_UN, Year, Population.type) %>%

  ## Tried first rank but did not provided ranks as integer...
  # mutate(ordering = rank(-Value), ties.method = "min") %>%

  mutate(ordering = rank(-Value2)) %>%
  ungroup()

## check our value for rank -- Note that there are different tie method
#levels(as.factor(rank_data.ref$ordering))

## need to fix manually issue when ex-aequo rank rank = 8.5

## In 1962
rank_data.ref$ordering[rank_data.ref$ordering == 10 &
                      rank_data.ref$Year == "1962" &
                      rank_data.ref$Population.type %in% c("REF")] <- 11

rank_data.ref$ordering[rank_data.ref$ordering == 8.5 &
                      rank_data.ref$Year == "1962" &
                      rank_data.ref$CountryAsylumName == "Burundi" &
                      rank_data.ref$Population.type %in% c("REF")] <- 9

rank_data.ref$ordering[rank_data.ref$ordering == 8.5 &
                      rank_data.ref$Year == "1962" &
                      rank_data.ref$CountryAsylumName == "Austria" &
                      rank_data.ref$Population.type %in% c("REF")] <- 10


## In 1978
rank_data.ref$ordering[rank_data.ref$ordering == 10 &
                      rank_data.ref$Year == "1978" &
                      rank_data.ref$Population.type %in% c("REF")] <- 11

rank_data.ref$ordering[rank_data.ref$ordering == 8.5 &
                      rank_data.ref$Year == "1978" &
                      rank_data.ref$CountryAsylumName == "Viet Nam" &
                      rank_data.ref$Population.type %in% c("REF")] <- 9

rank_data.ref$ordering[rank_data.ref$ordering == 8.5 &
                      rank_data.ref$Year == "1978" &
                      rank_data.ref$CountryAsylumName == "United Kingdom" &
                      rank_data.ref$Population.type %in% c("REF")] <- 10


## and for IPDs

rank_data.ref$CountryAsylumName <- as.character(rank_data.ref$CountryAsylumName)

## In 1996
rank_data.ref$ordering[rank_data.ref$ordering == 10 &
                      rank_data.ref$Year == "1996" &
                      rank_data.ref$Population.type %in% c("IDP")] <- 11

rank_data.ref$ordering[rank_data.ref$ordering == 9.5 &
                      rank_data.ref$Year == "1996" &
                      rank_data.ref$CountryAsylumName == "Somalia" &
                      rank_data.ref$Population.type %in% c("IDP")] <- 11


rank_data.ref$CountryAsylumName[rank_data.ref$ordering == 9.5 &
                      rank_data.ref$Year == "1996" &
                      rank_data.ref$CountryAsylumName == "Sri Lanka" &
                      rank_data.ref$Population.type %in% c("IDP")] <- "Sri Lanka / Somalia"

rank_data.ref$ordering[rank_data.ref$ordering == 9.5 &
                      rank_data.ref$Year == "1996" &
                      rank_data.ref$CountryAsylumName == "Sri Lanka / Somalia" &
                      rank_data.ref$Population.type %in% c("IDP")] <- 10

## in 1997
rank_data.ref$ordering[rank_data.ref$ordering == 10 &
                      rank_data.ref$Year == "1997" &
                      rank_data.ref$Population.type %in% c("IDP")] <- 11

rank_data.ref$ordering[rank_data.ref$ordering == 9.5 &
                      rank_data.ref$Year == "1997" &
                      rank_data.ref$CountryAsylumName == "Somalia" &
                      rank_data.ref$Population.type %in% c("IDP")] <- 11


rank_data.ref$CountryAsylumName[rank_data.ref$ordering == 9.5 &
                      rank_data.ref$Year == "1997" &
                      rank_data.ref$CountryAsylumName == "Sri Lanka" &
                      rank_data.ref$Population.type %in% c("IDP")] <- "Sri Lanka / Somalia"

rank_data.ref$ordering[rank_data.ref$ordering == 9.5 &
                      rank_data.ref$Year == "1997" &
                      rank_data.ref$CountryAsylumName == "Sri Lanka / Somalia" &
                      rank_data.ref$Population.type %in% c("IDP")] <- 10


rank_data.ref$CountryAsylumName <- as.factor(rank_data.ref$CountryAsylumName)

# Filter only top 10
rank_data.ref <- rank_data.ref[rank_data.ref$ordering <= 10, ]
#rank_data$Year = as.Date(as.character(rank_data$Year), format = "%Y")

## check our value for rank -- Note that there are different tie method
#levels(as.factor(rank_data.ref$ordering))

## Regnerate factors modality -
rank_data.ref$CountryAsylumName <- as.factor(as.character(rank_data.ref$CountryAsylumName))
# levels(as.factor(rank_data.ref$CountryAsylumName))
## Double checking country name
#table(end_year_population_totals_long$Country, useNA = "ifany")
Generate Plot
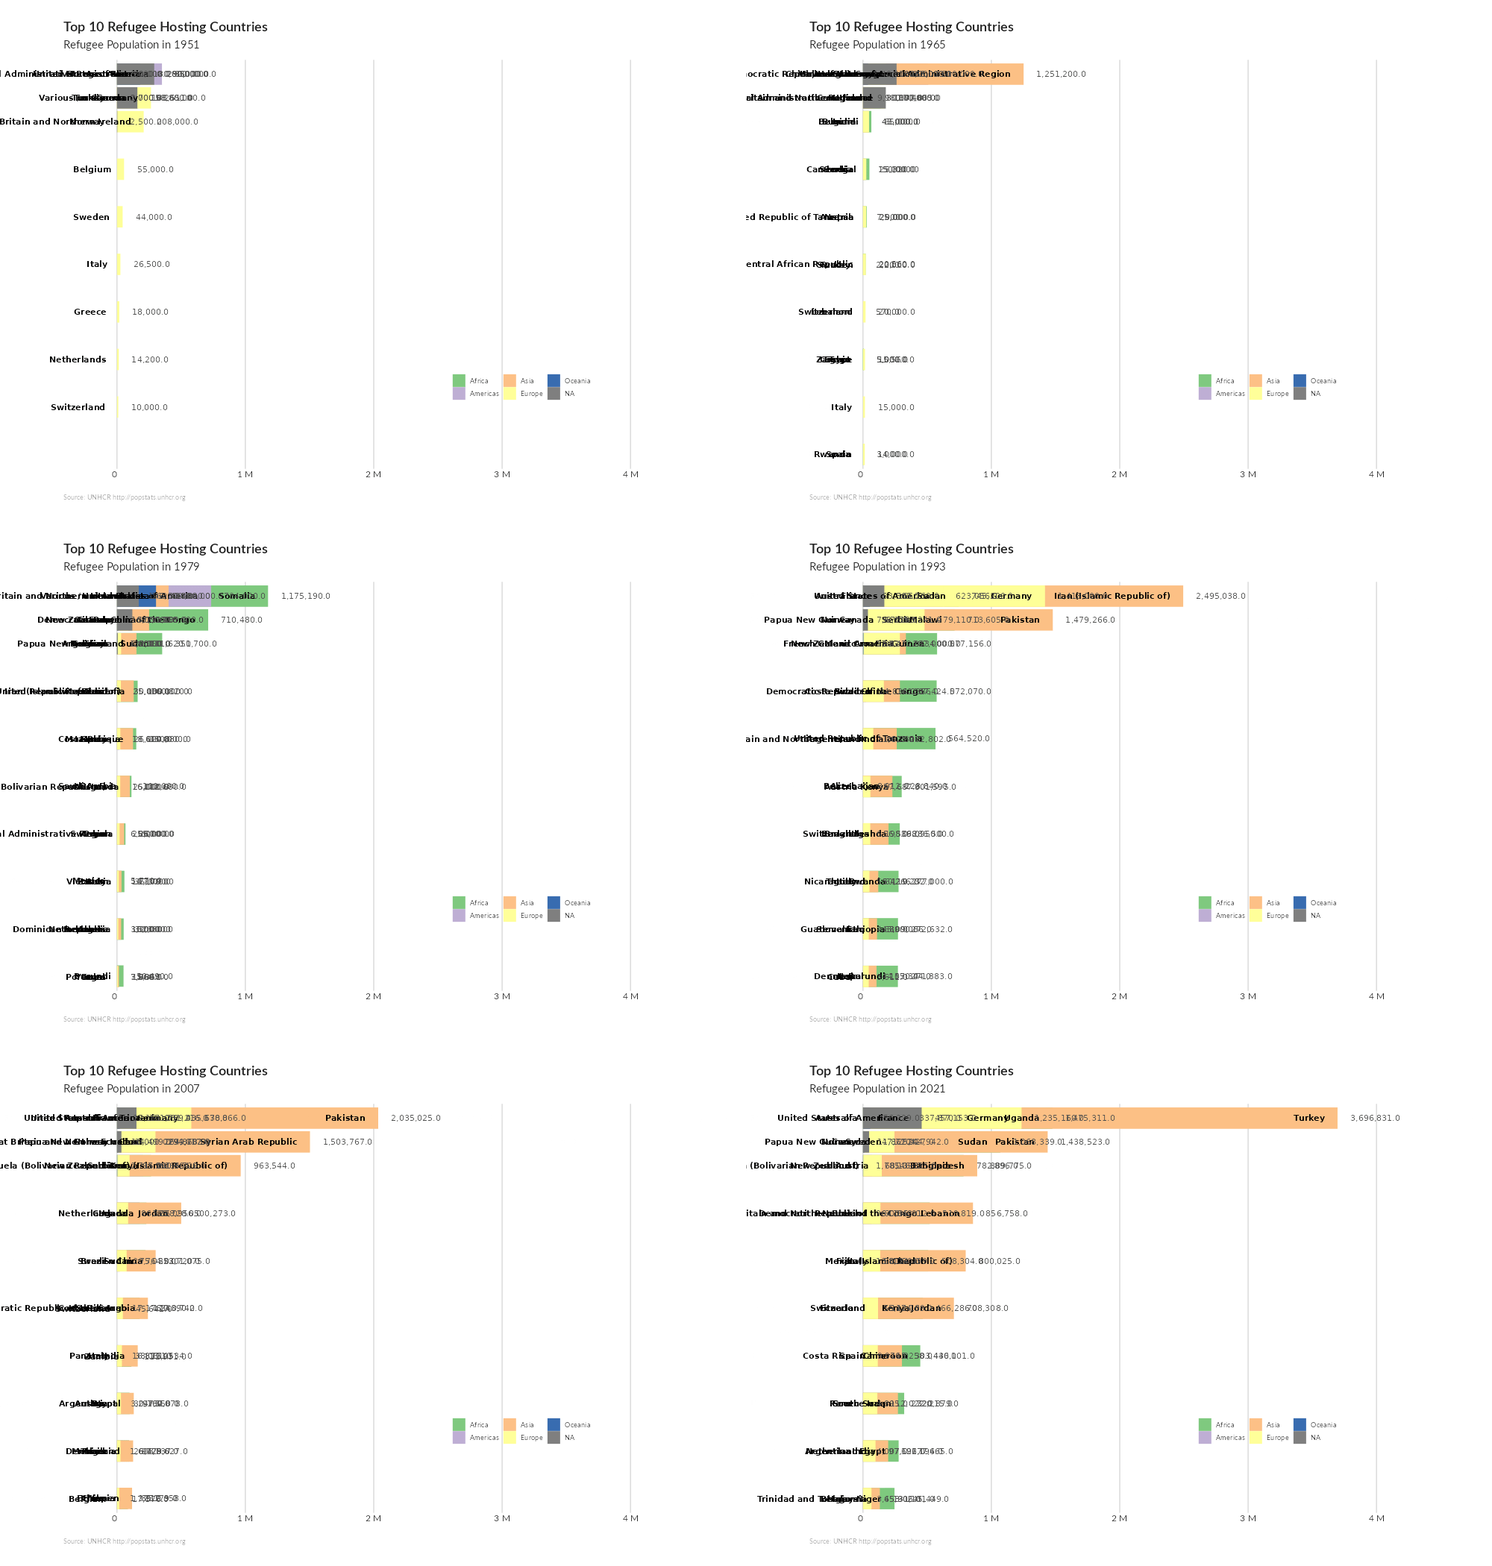
p <- rank_data.ref[rank_data.ref$Population.type %in% c("REF"), ] %>%
  ggplot(aes(y = Value2,
             x =   reorder(ordering, desc(ordering)),
             group = CountryAsylumName ,)) +
  geom_tile(aes(y = Value2 / 2,
                height = Value2,
                fill = REGION_UN), width = 0.9) +
  geom_text(aes(label = CountryAsylumName),
            hjust = "right", colour = "black",
            fontface = "bold", nudge_y = -100000) +
  geom_text(aes(label = scales::comma(Value2)),
            hjust = "left", nudge_y = 100000, colour = "grey30") +
  coord_flip(clip = "off") +
  scale_fill_manual(name = 'REGION_UN', values = c("#7fc97f", "#beaed4", "#fdc086", "#ffff99", "#386cb0")) +
  scale_x_discrete("") +
  scale_y_continuous("",labels = unhcRstyle::format_si()) +

  unhcRstyle::unhcr_theme() +
#  hrbrthemes::theme_ipsum(plot_title_size = 32, subtitle_size = 24, caption_size = 12, base_size = 22) +
  theme(panel.grid.major.y = element_blank(),
        panel.grid.minor.x = element_blank(),
        legend.position = c(0.8, 0.2),
        legend.title = element_blank(),
        plot.margin = margin(1,1,1,3,"cm"),
        axis.text.y = element_blank()) +
  # gganimate code to transition by year:
  gganimate::transition_time(Year) +
  gganimate::ease_aes('cubic-in-out') +
  labs(title = 'Top 10 Refugee Hosting Countries',
       subtitle = 'Refugee Population in {round(frame_time,0)}',
       caption = 'Source: UNHCR http://popstats.unhcr.org')

library(gganimate)

#For GIF File Format:c
gganimate::animate(p, #plot
        nframes = 1000, # The number of frames to render (default 100)
        fps = 20,   # The framerate of the animation in frames/sec (default 10)
        width = 1000,
        height = 700,
        end_pause = 50,
        renderer = gifski_renderer("anim_ref_race.gif"))