thisbureau <- "Americas"
lastyear <- max(unhcrdatapackage::end_year_population_totals_long$Year)
end_year_population_totals_long.asy <- dplyr::left_join( x= unhcrdatapackage::end_year_population_totals_long,
y= unhcrdatapackage::reference,
by = c("CountryAsylumCode" = "iso_3"))
# Create data
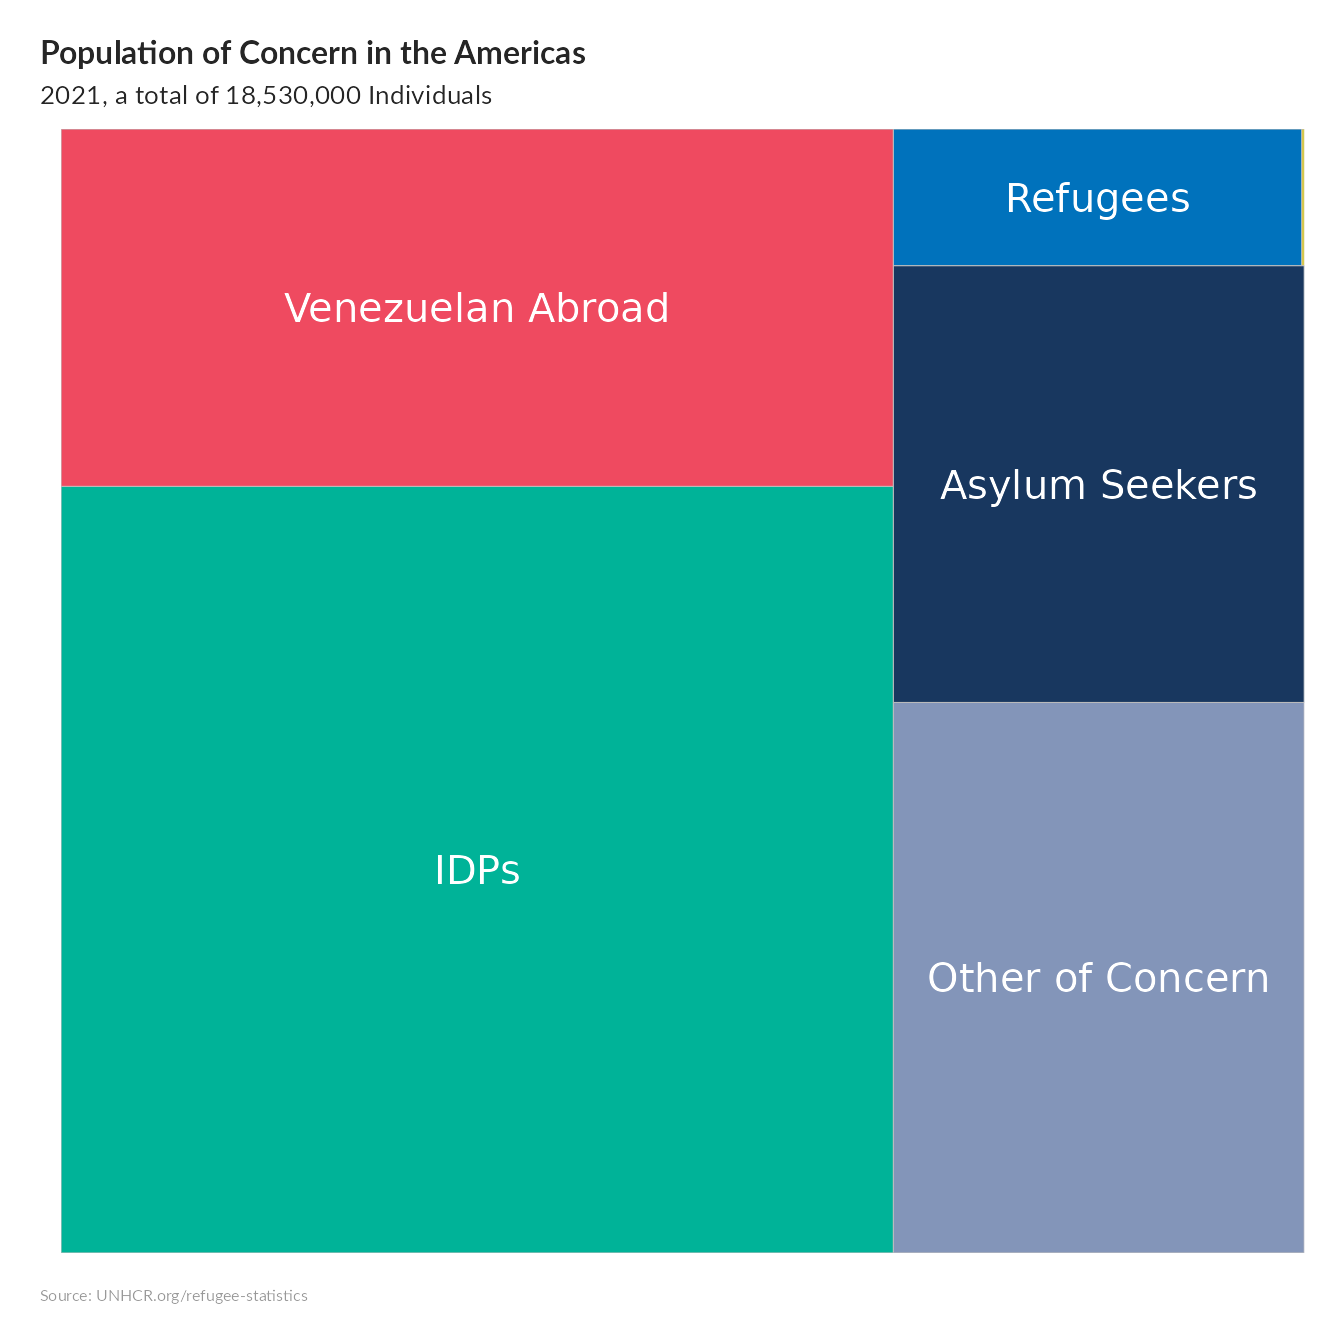
group <- c("IDPs",
"Venezuelan Abroad",
"Asylum Seekers",
"Refugees",
"Other of Concern",
"Stateless")
valuelastyearworld <- c(as.integer(sum(end_year_population_totals_long.asy[ end_year_population_totals_long.asy$Year ==lastyear & end_year_population_totals_long.asy$Population.type =="IDP" ,
c("Value")])),
as.integer(sum(end_year_population_totals_long.asy[ end_year_population_totals_long.asy$Year ==lastyear & end_year_population_totals_long.asy$Population.type =="VDA" ,
c("Value")])),
as.integer(sum(end_year_population_totals_long.asy[ end_year_population_totals_long.asy$Year ==lastyear & end_year_population_totals_long.asy$Population.type =="ASY" ,
c("Value")])),
as.integer(sum(end_year_population_totals_long.asy[ end_year_population_totals_long.asy$Year ==lastyear & end_year_population_totals_long.asy$Population.type =="REF" ,
c("Value")])),
as.integer(sum(end_year_population_totals_long.asy[ end_year_population_totals_long.asy$Year ==lastyear & end_year_population_totals_long.asy$Population.type =="OOC" ,
c("Value")])),
as.integer(sum(end_year_population_totals_long.asy[ end_year_population_totals_long.asy$Year ==lastyear & end_year_population_totals_long.asy$Population.type =="STA" ,
c("Value")])) )
valuelastyear <- c(as.integer(sum(end_year_population_totals_long.asy[end_year_population_totals_long.asy$UNHCRBureau == thisbureau & end_year_population_totals_long.asy$Year ==lastyear & end_year_population_totals_long.asy$Population.type =="IDP" ,
c("Value")])),
as.integer(sum(end_year_population_totals_long.asy[end_year_population_totals_long.asy$UNHCRBureau == thisbureau & end_year_population_totals_long.asy$Year ==lastyear & end_year_population_totals_long.asy$Population.type =="VDA" ,
c("Value")])),
as.integer(sum(end_year_population_totals_long.asy[end_year_population_totals_long.asy$UNHCRBureau == thisbureau & end_year_population_totals_long.asy$Year ==lastyear & end_year_population_totals_long.asy$Population.type =="ASY" ,
c("Value")])),
as.integer(sum(end_year_population_totals_long.asy[end_year_population_totals_long.asy$UNHCRBureau == thisbureau & end_year_population_totals_long.asy$Year ==lastyear & end_year_population_totals_long.asy$Population.type =="REF" ,
c("Value")])),
as.integer(sum(end_year_population_totals_long.asy[end_year_population_totals_long.asy$UNHCRBureau == thisbureau & end_year_population_totals_long.asy$Year ==lastyear & end_year_population_totals_long.asy$Population.type =="OOC" ,
c("Value")])),
as.integer(sum(end_year_population_totals_long.asy[end_year_population_totals_long.asy$UNHCRBureau == thisbureau & end_year_population_totals_long.asy$Year ==lastyear & end_year_population_totals_long.asy$Population.type =="STA" ,
c("Value")])) )