Refugee Status Determination Application
Source:vignettes/Refugee_Status_Determination_Application.Rmd
Refugee_Status_Determination_Application.RmdPrepare Data
thisbureau <- "Americas"
lastyear <- max(unhcrdatapackage::end_year_population_totals_long$Year)

topasyl <-  unhcrdatapackage::asylum_decisions %>%
  ## Add reference for the filters
  dplyr::left_join( unhcrdatapackage::reference %>%
                      select(coa_region = `UNHCRBureau`, iso_3),  by = c("CountryAsylumCode" = "iso_3")) %>%
  filter(coa_region == thisbureau & Year == lastyear) %>%
 # select(region_asy, ctry_asy, year, recognizedConvMandate, recognizedOther, appliedDuringTheYear, meta_applicationAveragePersonsPerCase) %>%
  mutate(DecisionsAveragePersonsPerCase = map_dbl(DecisionsAveragePersonsPerCase, ~replace_na(max(as.numeric(.), 1), 1))) %>%
  group_by(CountryAsylumName) %>%
  summarize(Recognized = sum(Recognized * DecisionsAveragePersonsPerCase, na.rm = TRUE),
            ComplementaryProtection = sum(ComplementaryProtection * DecisionsAveragePersonsPerCase, na.rm = TRUE),
            TotalDecided = sum(TotalDecided * DecisionsAveragePersonsPerCase, na.rm = TRUE)) %>%
  mutate(RefugeeRecognitionRate = (Recognized ) / TotalDecided,
         GlobalRecognitionRate = (Recognized + ComplementaryProtection) / TotalDecided ) %>%
  filter(TotalDecided  != 0) %>%
  filter(TotalDecided  > 1000)  %>%
  mutate(CountryAsylumName = str_replace(CountryAsylumName, "United States of America", "USA"))

topasyl1 <-  topasyl  %>%
  arrange(desc(TotalDecided)) %>%
  head(10)


topOrigin <-  unhcrdatapackage::asylum_decisions %>%
  ## Add reference for the filters
  dplyr::left_join( unhcrdatapackage::reference %>%
                      select(coa_region = `UNHCRBureau`, iso_3),  by = c("CountryOriginCode" = "iso_3")) %>%
  filter(coa_region == thisbureau & Year == lastyear) %>%
 # select(region_asy, ctry_asy, year, recognizedConvMandate, recognizedOther, appliedDuringTheYear, meta_applicationAveragePersonsPerCase) %>%
  mutate(DecisionsAveragePersonsPerCase = map_dbl(DecisionsAveragePersonsPerCase, ~replace_na(max(as.numeric(.), 1), 1))) %>%
  group_by(CountryOriginName) %>%
  summarize(Recognized = sum(Recognized * DecisionsAveragePersonsPerCase, na.rm = TRUE),
            ComplementaryProtection = sum(ComplementaryProtection * DecisionsAveragePersonsPerCase, na.rm = TRUE),
            TotalDecided = sum(TotalDecided * DecisionsAveragePersonsPerCase, na.rm = TRUE)) %>%
  mutate(RefugeeRecognitionRate = (Recognized ) / TotalDecided,
         GlobalRecognitionRate = (Recognized + ComplementaryProtection) / TotalDecided) %>%
  filter(TotalDecided  != 0) %>%
  filter(TotalDecided  > 1000)  %>%
  mutate(CountryOriginName = str_replace(CountryOriginName, " \\(Bolivarian Republic of\\)", ""))

topOrigin1 <-  topOrigin  %>%
  arrange(desc(TotalDecided)) %>%
  head(10)
Generate plot
rsdasyl <- ggplot(topasyl1, aes(y = TotalDecided,
x = reorder(CountryAsylumName, TotalDecided))) +
scale_y_continuous( label = scales::label_number_si()) + ## Format axis number
#facet_grid(.~ ctry_asy) +
geom_bar( stat ="identity", fill = unhcRstyle::unhcr_blue) +
coord_flip() +
labs(#title = "Number of RSD application in 2020",
subtitle = "Per country of asylum",
x = " ",
y = " " ) +
unhcRstyle::unhcr_theme(base_size = 9) +
theme(#axis.text.x = element_blank(),
# legend.position = "none",
panel.grid.major.x = element_line(color = "#cbcbcb"),
panel.grid.major.y = element_blank()) +### changing grid line that should appear) +
geom_hline(yintercept = 0, size = 1.1, colour = "#333333")
##############################################################
##############################################################
rsdorigin <- ggplot(topOrigin1, aes(y = TotalDecided,
x = reorder(CountryOriginName, TotalDecided))) +
scale_y_continuous( label = scales::label_number_si()) + ## Format axis number
#facet_grid(.~ ctry_asy) +
geom_bar( stat ="identity", fill = unhcRstyle::unhcr_blue) +
coord_flip() +
labs(#title = "Number of RSD application per country of Origin in 2020",
subtitle = "Per country of Origin",
x = " ",
y = " " ) +
unhcRstyle::unhcr_theme(base_size = 9) +
theme(#axis.text.x = element_blank(),
# legend.position = "none",
panel.grid.major.x = element_line(color = "#cbcbcb"),
panel.grid.major.y = element_blank()) +### changing grid line that should appear) +
geom_hline(yintercept = 0, size = 1.1, colour = "#333333")
##########################
#joining charts
##################
library(patchwork)
patchworkRSDa <- rsdasyl + rsdorigin
patchworkRSDa1 <- patchworkRSDa +
#unhcRstyle::unhcr_theme(base_size = 8) + ## Insert UNHCR Style
theme(legend.position = "none") +
plot_annotation(
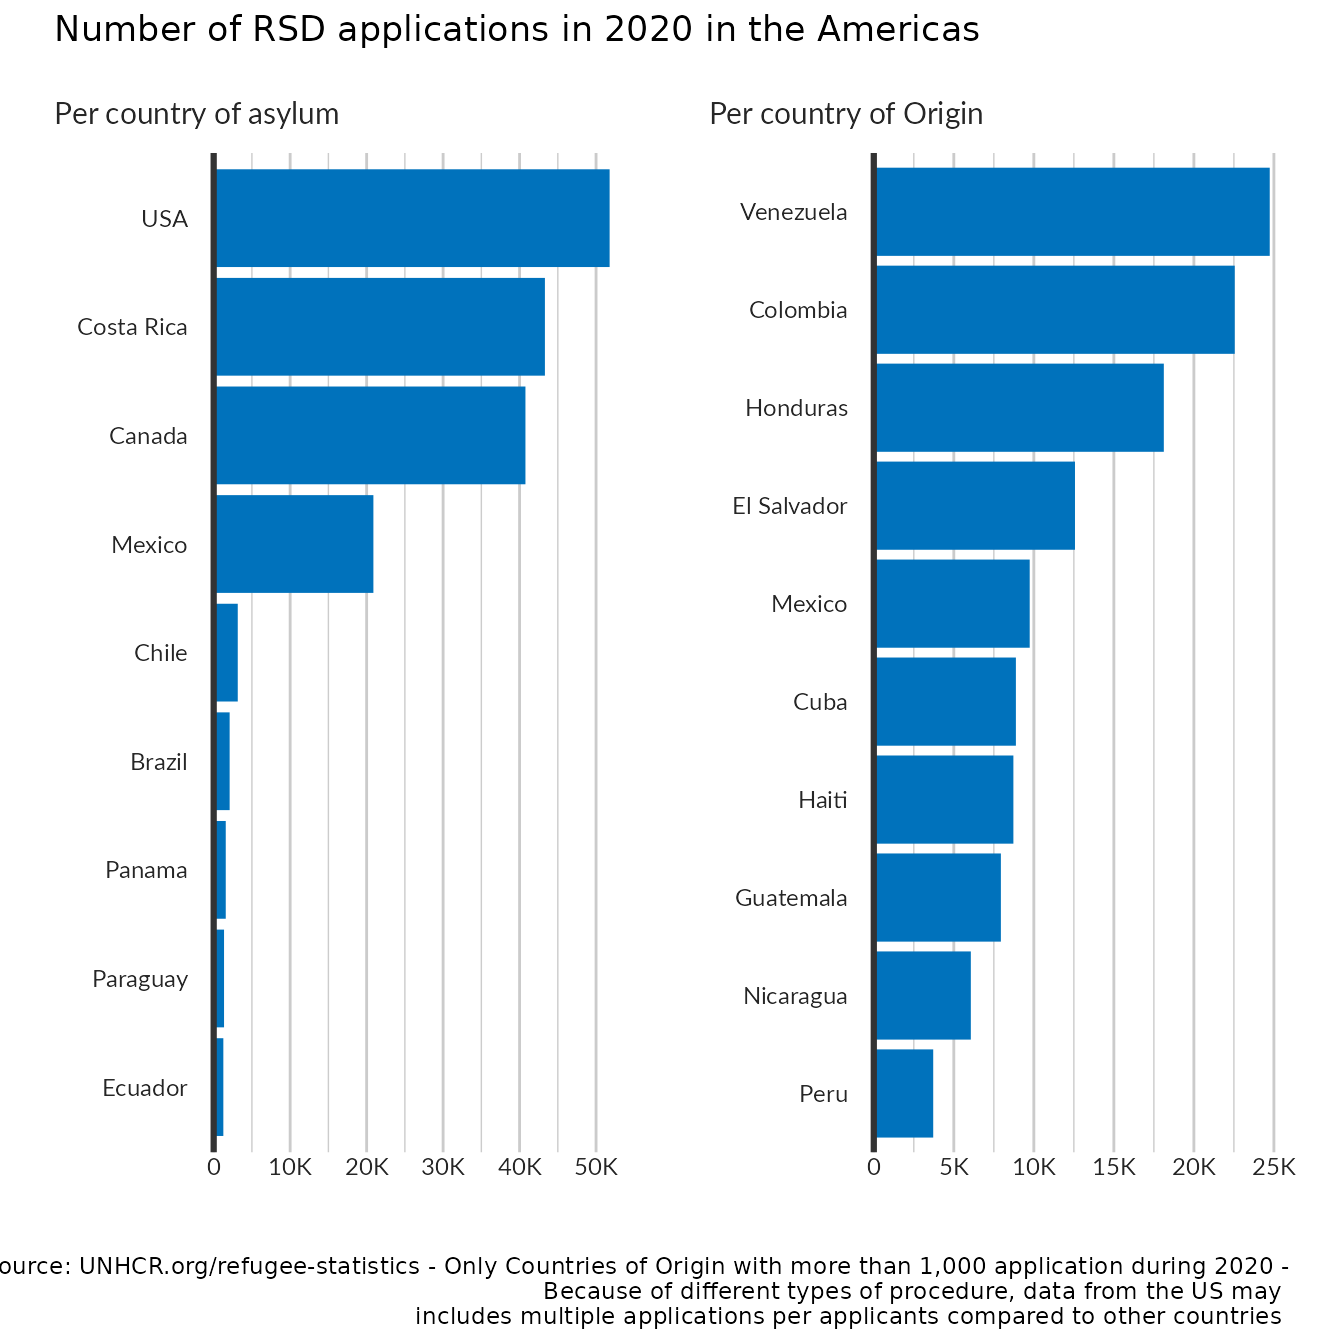
title = 'Number of RSD applications in 2020 in the Americas ',
# subtitle = ' ',
caption = 'Source: UNHCR.org/refugee-statistics - Only Countries of Origin with more than 1,000 application during 2020 -\n Because of different types of procedure, data from the US may \n includes multiple applications per applicants compared to other countries '
)
patchworkRSDa1