#Make plot
ggplot(data, aes(x = Year, y = Value2)) +
geom_line(colour = "#0072bc", size = 1) + # Here we mention that it will be a line chart
# geom_hline(yintercept = 0, size = 1, colour = "#333333") +
unhcRstyle::unhcr_theme(base_size = 9) + ## Insert UNHCR Style
scale_y_continuous( label = scales::label_number_si()) + ## Format axis number
## and the chart labels
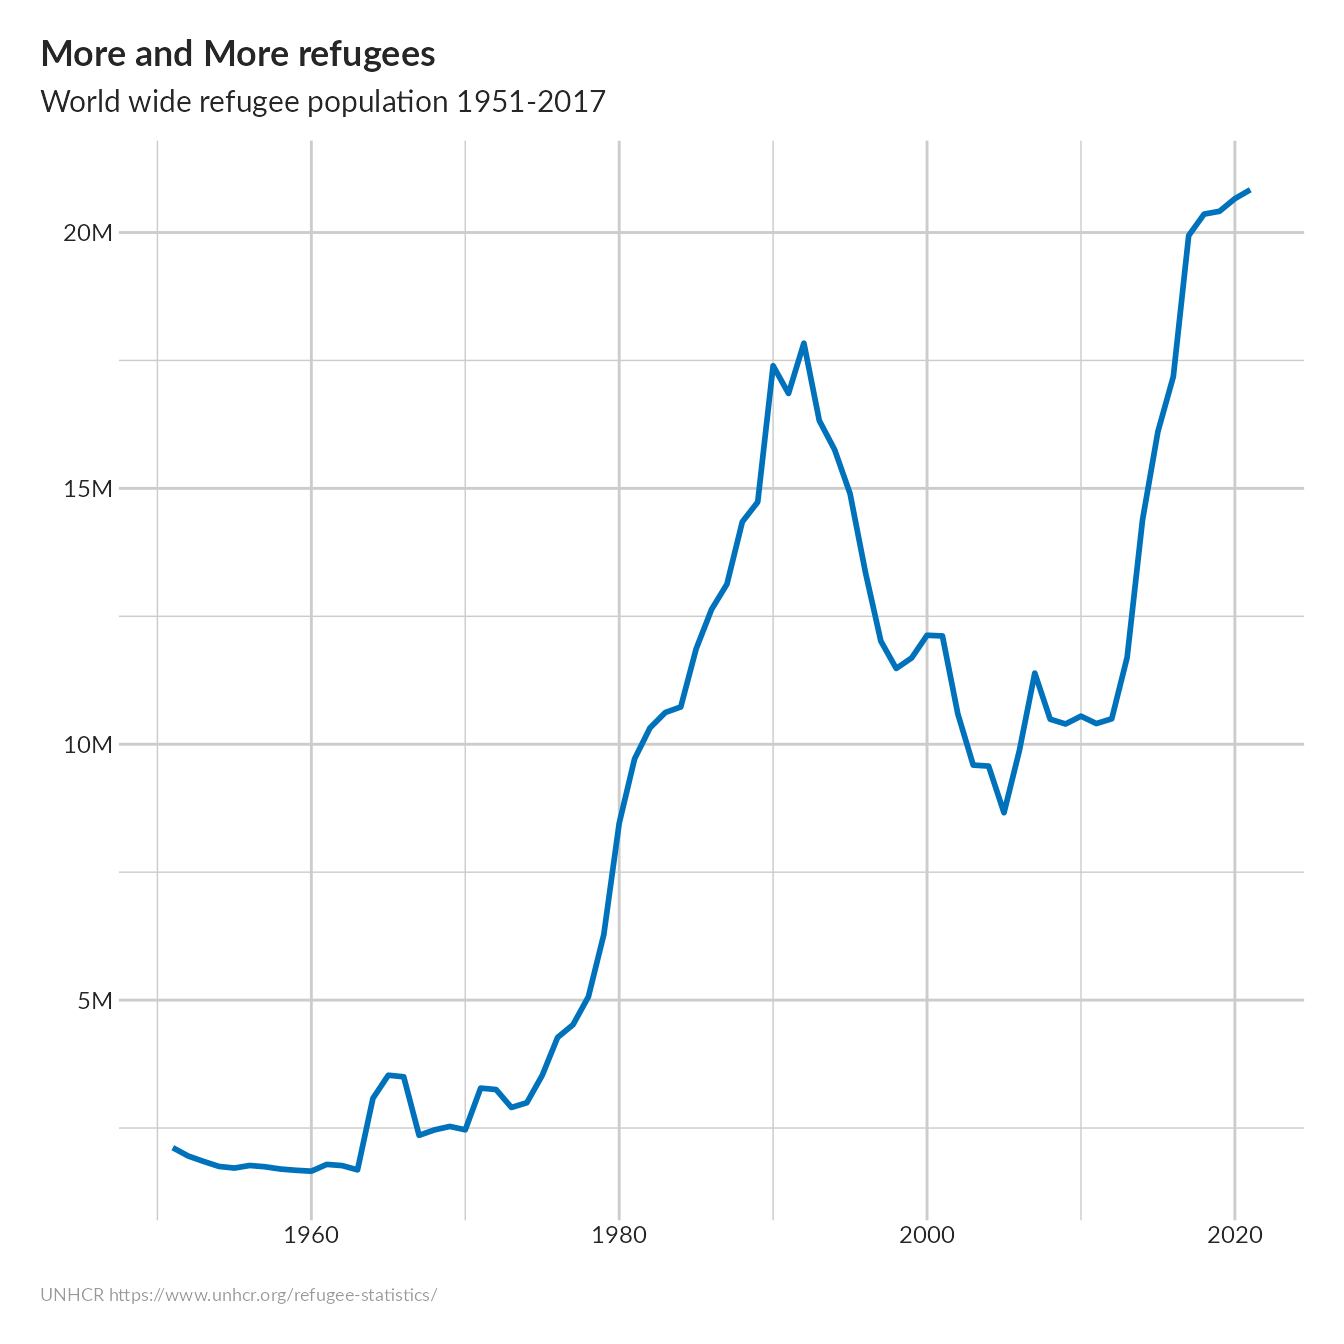
labs(title = "More and More refugees",
x = "",
y = "",
subtitle = "World wide refugee population 1951-2017",
caption = "UNHCR https://www.unhcr.org/refugee-statistics/")