Prepare Data
demographics <- merge(x = unhcrdatapackage::demographics, by.x="CountryOriginCode",
                      y = unhcrdatapackage::reference, by.y= "iso_3",
                      all.x = TRUE)
#names(demographics)
pyramid <-  demographics[ demographics$Year == max(demographics$Year),
                          c("REGION_UN",
                          "Female04",
                              "Female511",
                              "Female1217",
                              "Female1859",
                              "Female60ormore",
                              "FemaleUnknown",
                             # "FemaleTotal",
                              "Male04",
                              "Male511",
                              "Male1217",
                              "Male1859",
                              "Male60ormore",
                              "MaleUnknown"#,
                             # "MaleTotal"
                             )]


pyramid2 <- data.frame(lapply(pyramid, function(x) { as.numeric( gsub("NA", "0", x)) })) %>%
  pivot_longer(
    cols = Female04:MaleUnknown,
    names_to = "Class",
    #names_to = c("Class","REGION_UN" ),
    #names_sep = "_",
     #names_repair = "unique",
    #names_prefix = "",
    values_to = "Sum",
    values_drop_na = TRUE
  )
#> Warning in FUN(X[[i]], ...): NAs introduced by coercion

pyramid3 <- as.data.frame(aggregate(pyramid2$Sum,
                                          by = list(pyramid2$Class#, pyramid2$REGION_UN
                                                    ),
                                          sum))
names(pyramid3)[1] <- "Class"
names(pyramid3)[2] <- "Count"

pyramid3 <- pyramid3 %>%
  mutate(gender = case_when(str_detect(Class, "Male") ~ "Male",
                            str_detect(Class, "Female") ~ "Female")) %>%
  mutate(age = case_when(str_detect(Class, "04") ~ "0-4",
                         str_detect(Class, "511") ~ "5-11",
                         str_detect(Class, "1217") ~ "12-17",
                         str_detect(Class, "1859") ~ "18-59",
                         str_detect(Class, "60") ~ "60+",
                         str_detect(Class, "Unknown") ~ "Unknown"))

pyramid3$pc <- pyramid3$Count / sum(pyramid3$Count) * 100
pyramid3$age <- factor(pyramid3$age, levels = c("0-4", "5-11",  "12-17",  "18-59", "60+", "Unknown"))
Generate Plot
ggplot(pyramid3, aes(x = age, fill = gender,
y = ifelse(test = gender == "Female",
yes = -pc, no = pc))) +
geom_bar(stat = "identity") +
scale_y_continuous(labels = abs, limits = max(pyramid3$pc) * c(-1,1)) +
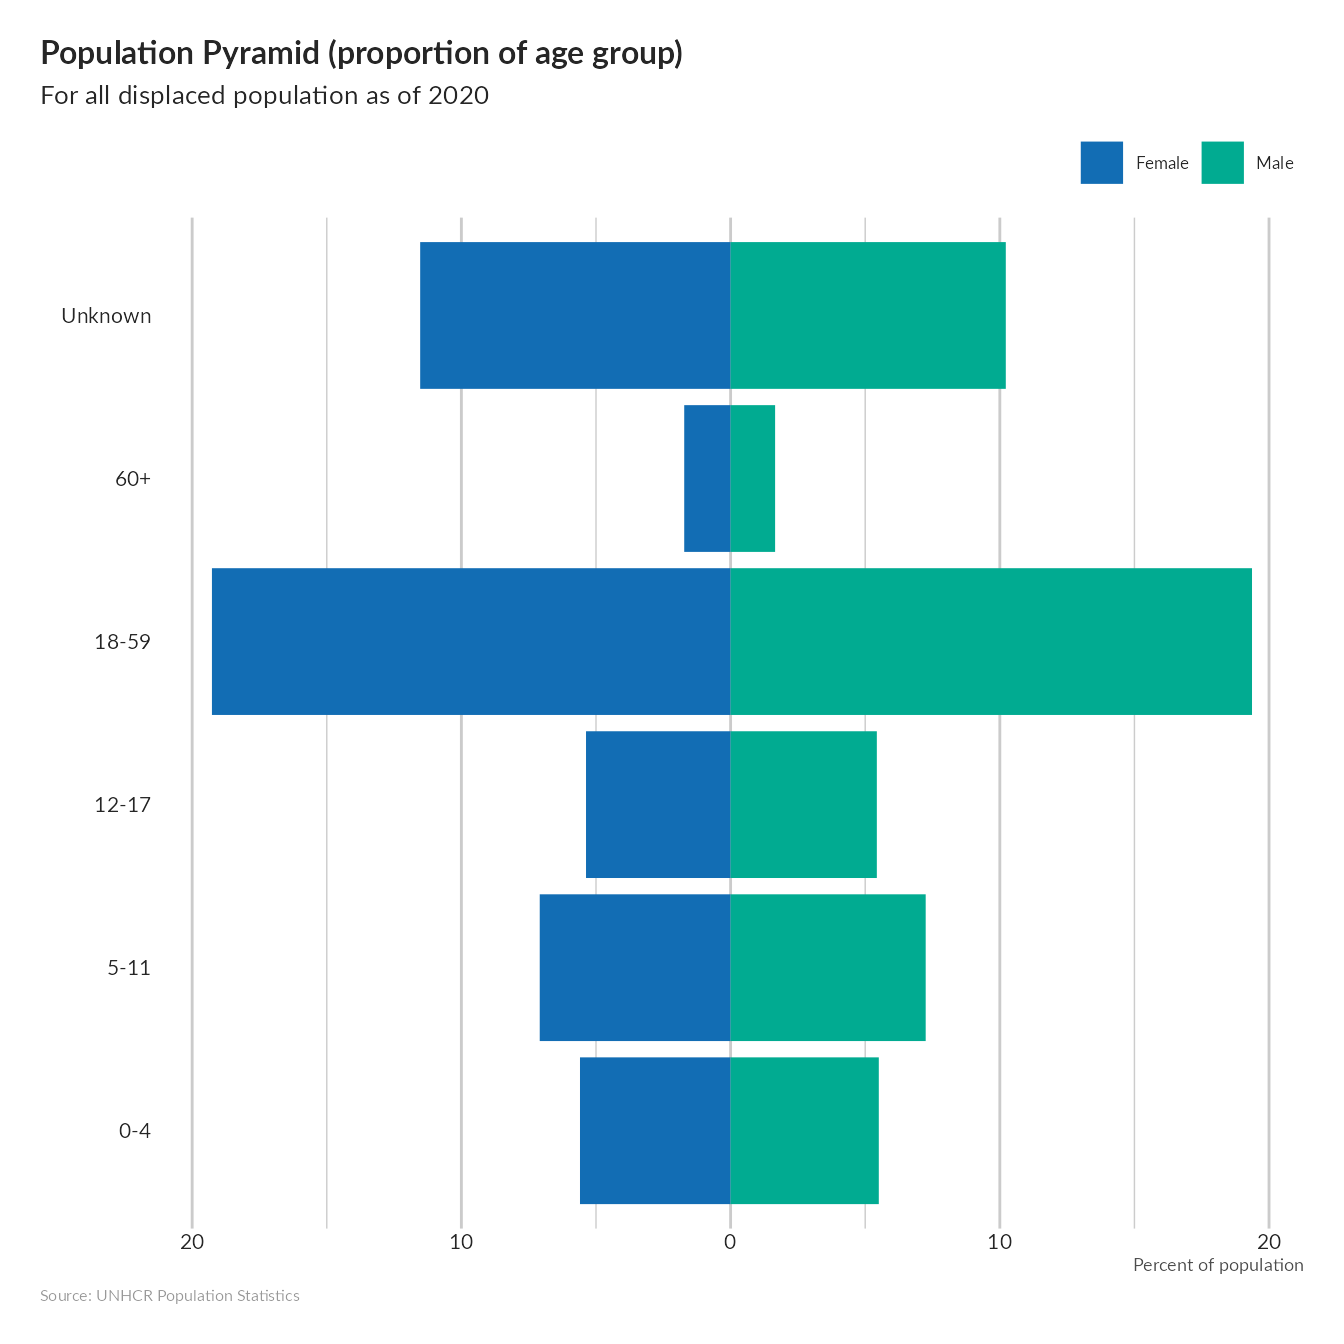
labs(title = "Population Pyramid (proportion of age group) ",
subtitle = paste0("For all displaced population as of ", max(demographics$Year)),
x = "",
y = "Percent of population",
caption = "Source: UNHCR Population Statistics") +
scale_colour_manual(values = c("#126db4","#01ab91"), # based on Asia Report
#scale_colour_manual(values = c("pink", "steelblue"),
aesthetics = c("colour", "fill")) +
coord_flip()+
unhcRstyle::unhcr_theme(base_size = 8) +
theme(panel.grid.major.x = element_line(color = "#cbcbcb"),
panel.grid.major.y = element_blank())